
Bitcoin slips amid renewed US regional bank stress
Bitcoin (BTC) tumbled to its lowest level in 15 weeks on Friday, falling below $105,000 as worries about US regional banks rippled through markets. The abrupt move revived memories of March 2023, when regional banking turmoil triggered a sharp crypto sell-off and a rapid, volatile correction across Bitcoin and major altcoins.
Crypto traders are now eyeing the $100,000 mark as a critical support level. A breach could intensify downside pressure on Bitcoin price and reshape near-term market sentiment for the wider blockchain and crypto sector.
BTC/USD chart snapshot
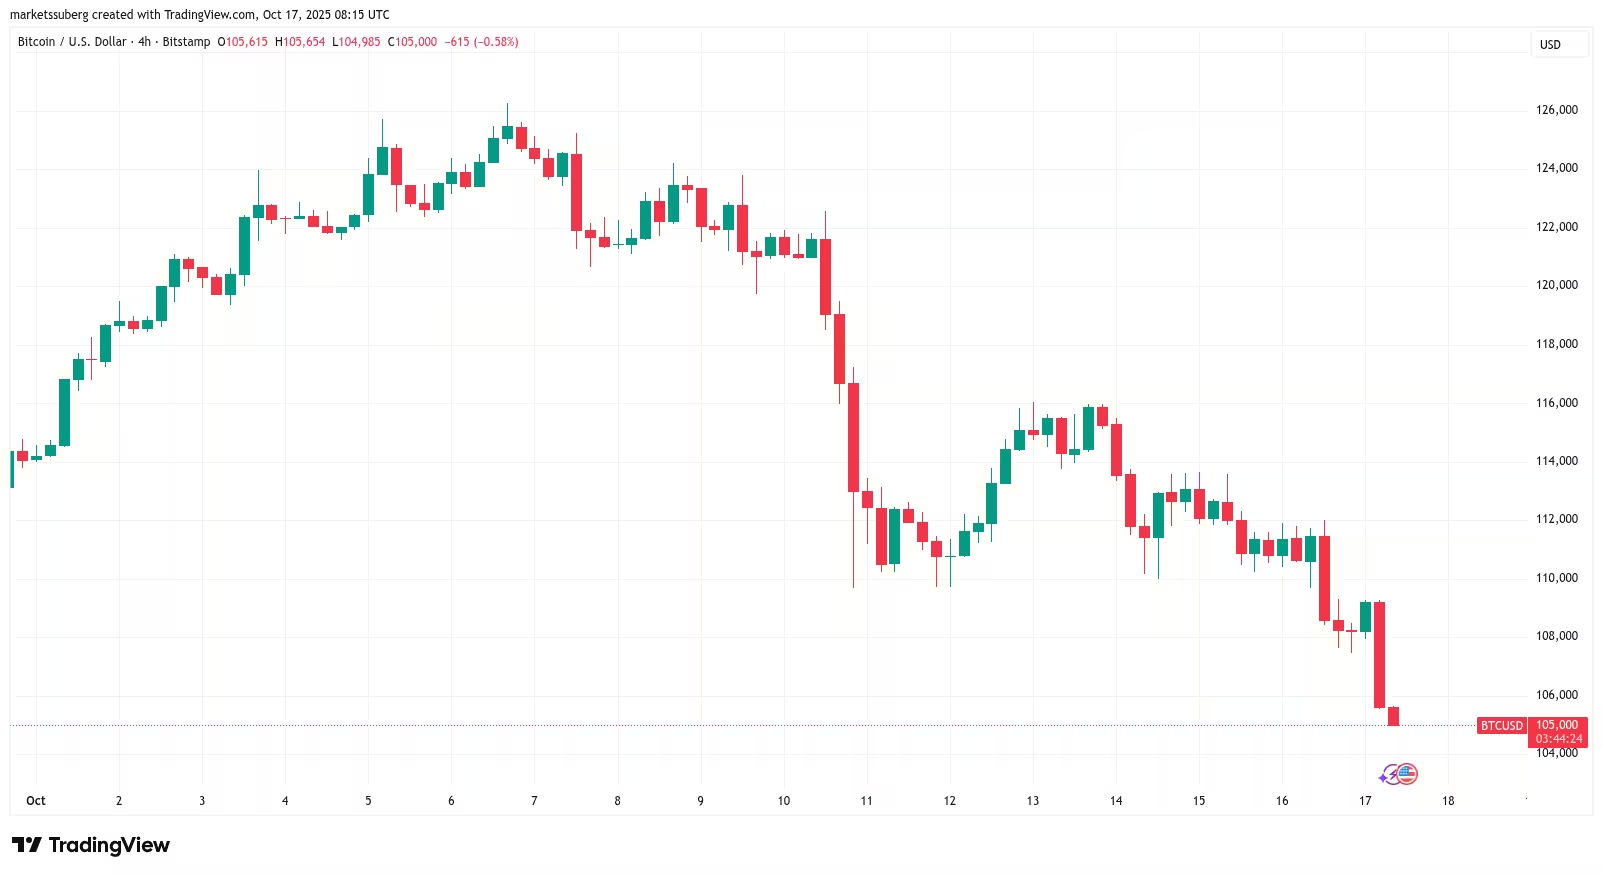
BTC/USD four-hour chart
Why the decline happened
Data from Cointelegraph Markets Pro and TradingView showed BTC slipping under $106,000 for the first time since June. The catalyst was a renewed sell-off in US regional bank stocks, which began to mirror the stress seen in March 2023. Back then, the panic spilled into crypto markets and briefly drove BTC/USD below key psychological and technical levels.
Market commentators and trading accounts flagged the parallels. The Kobeissi Letter observed that while the 2023 banking crisis was described as "contained," underlying vulnerabilities remained. That backdrop combined with broader macro uncertainty to pressure risk assets, including Bitcoin and other cryptocurrencies.
Traders warn of retest and potential breakdown
Several traders warned that the $100,000 support band could be tested and potentially fail. One trader suggested a downside scenario that could send BTC toward $98,000 if that key support does not hold. Others argue that Bitcoin may simply be filling a short-term wick left on Binance last week, which briefly took price down to roughly $102,000 amid US-China trade and liquidity worries.
“$BTC has lost the $108,000 support level. Now there’s little to no support until $101,000–$102,000,” said crypto investor Ted Pillows, highlighting the limited buffer provided by recent moving averages.
Technical picture: moving averages and support levels
Earlier moving averages on daily timeframes failed to hold as reliable support, with Bitcoin testing its 200-day moving average for the first time in over six months. If BTC reclaims the $110,000 band, traders say a bounce could follow. Absent that, more volatility and downside are likely before relief arrives.
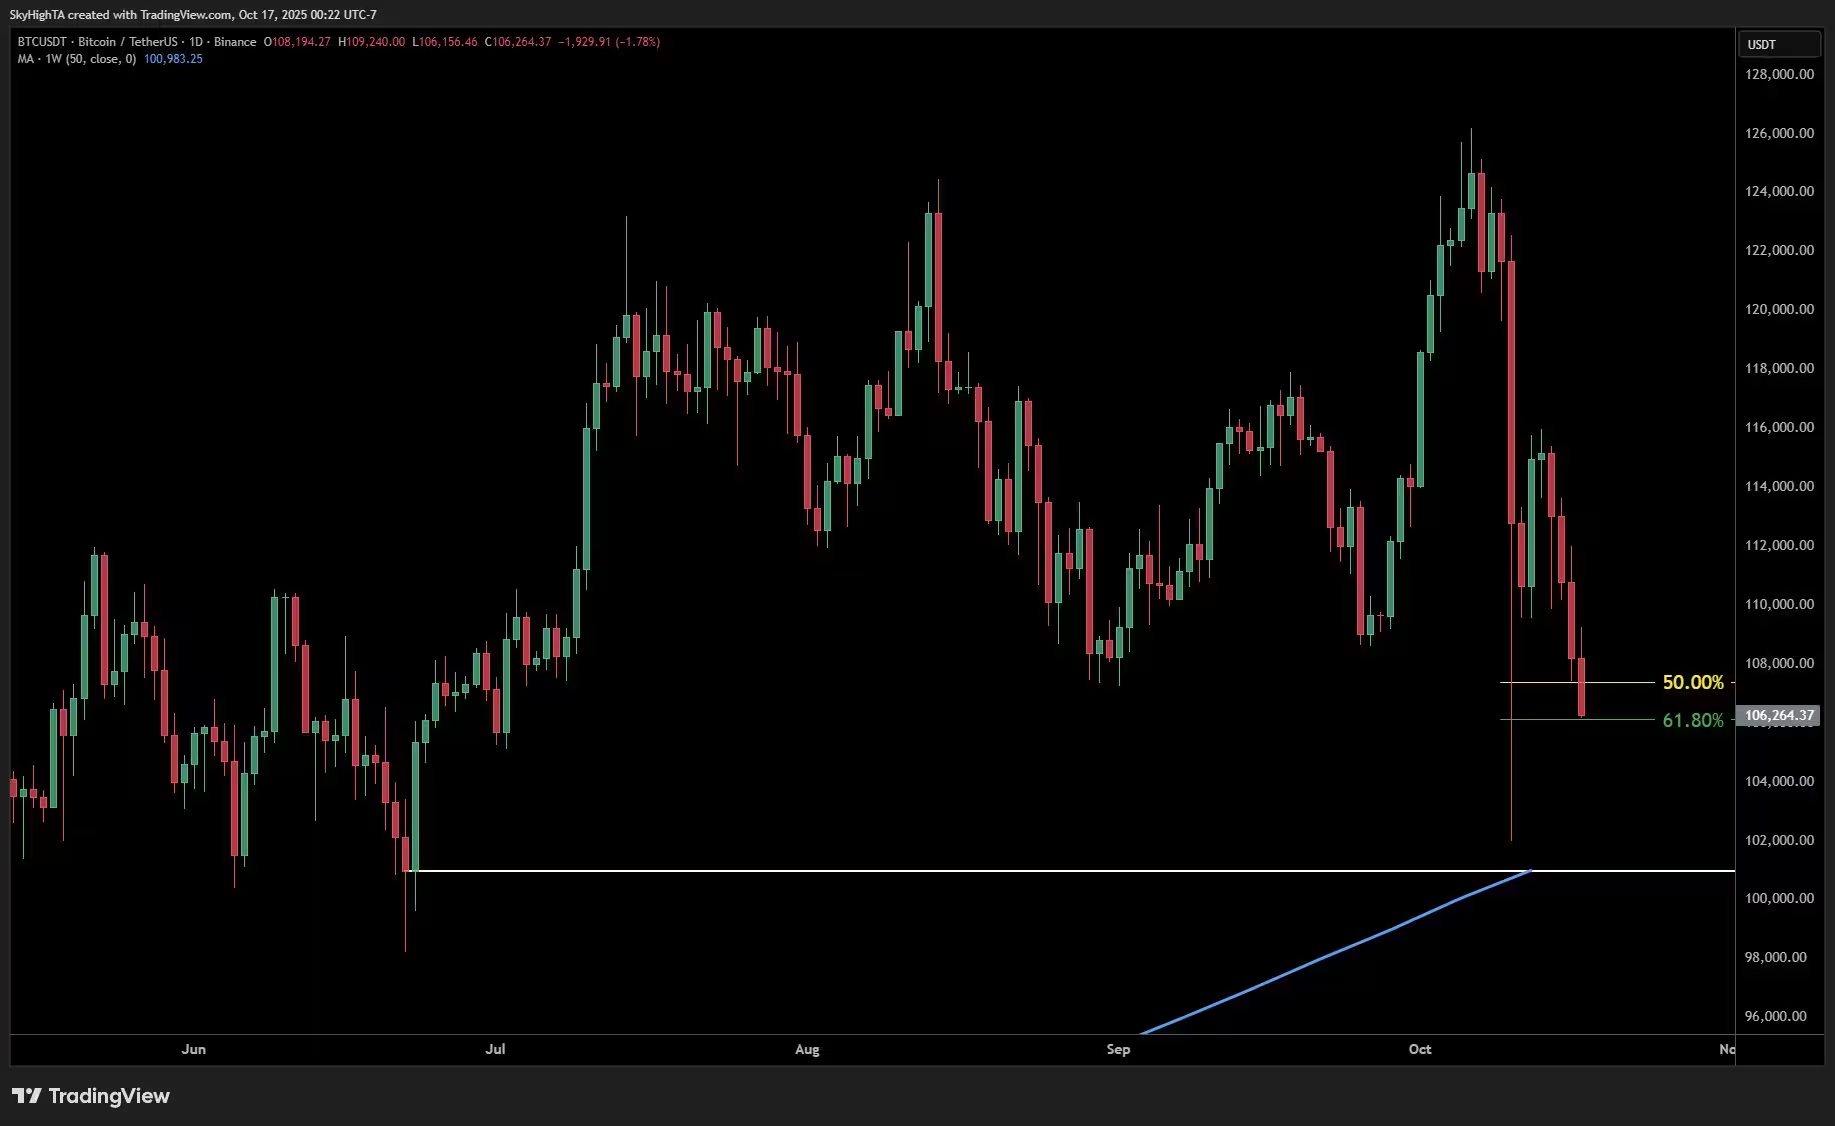
BTC/USD one-day chart with 50-week MA
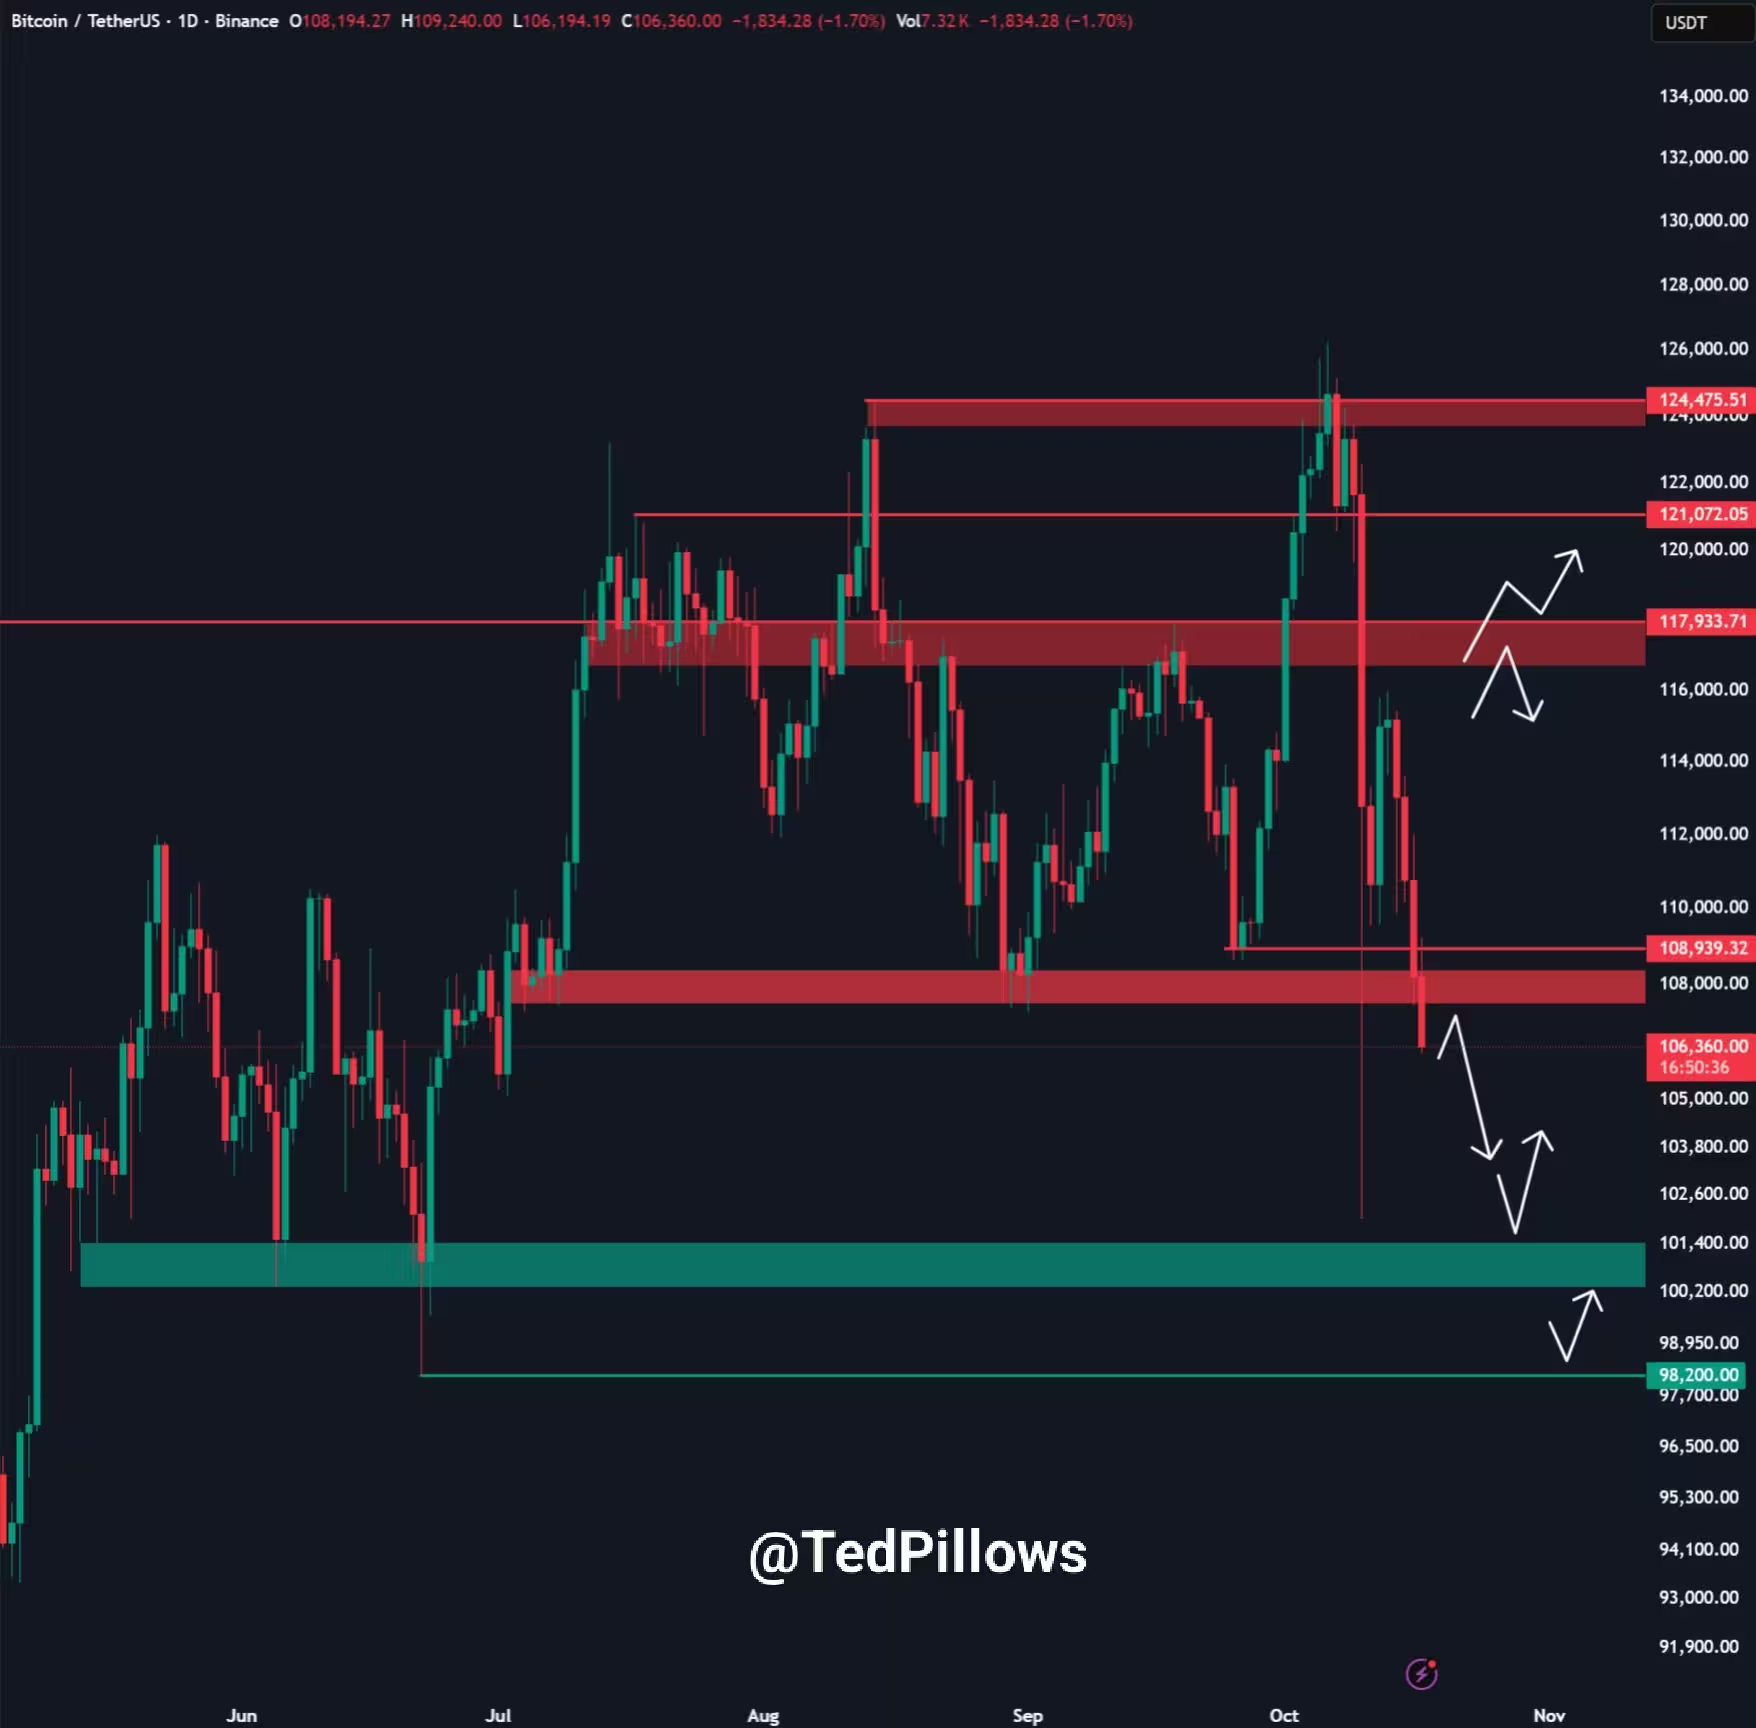
BTC/USDT one-day chart
Gold vs. Bitcoin: a narrative split
As banking-led uncertainty mounted, gold — the traditional safe-haven asset — pushed to fresh all-time highs, creating a divergence with Bitcoin. Prominent gold advocate and Bitcoin skeptic Peter Schiff predicted that gold could reach $1 million per ounce before Bitcoin attains a similar valuation milestone in dollar terms, arguing that Bitcoin has failed to become a true alternative to the US dollar or a reliable digital gold.
“Gold is more likely to hit $1 million than Bitcoin,” Schiff wrote, underscoring a narrative that some investors are shifting to precious metals amid the latest financial sector stress.
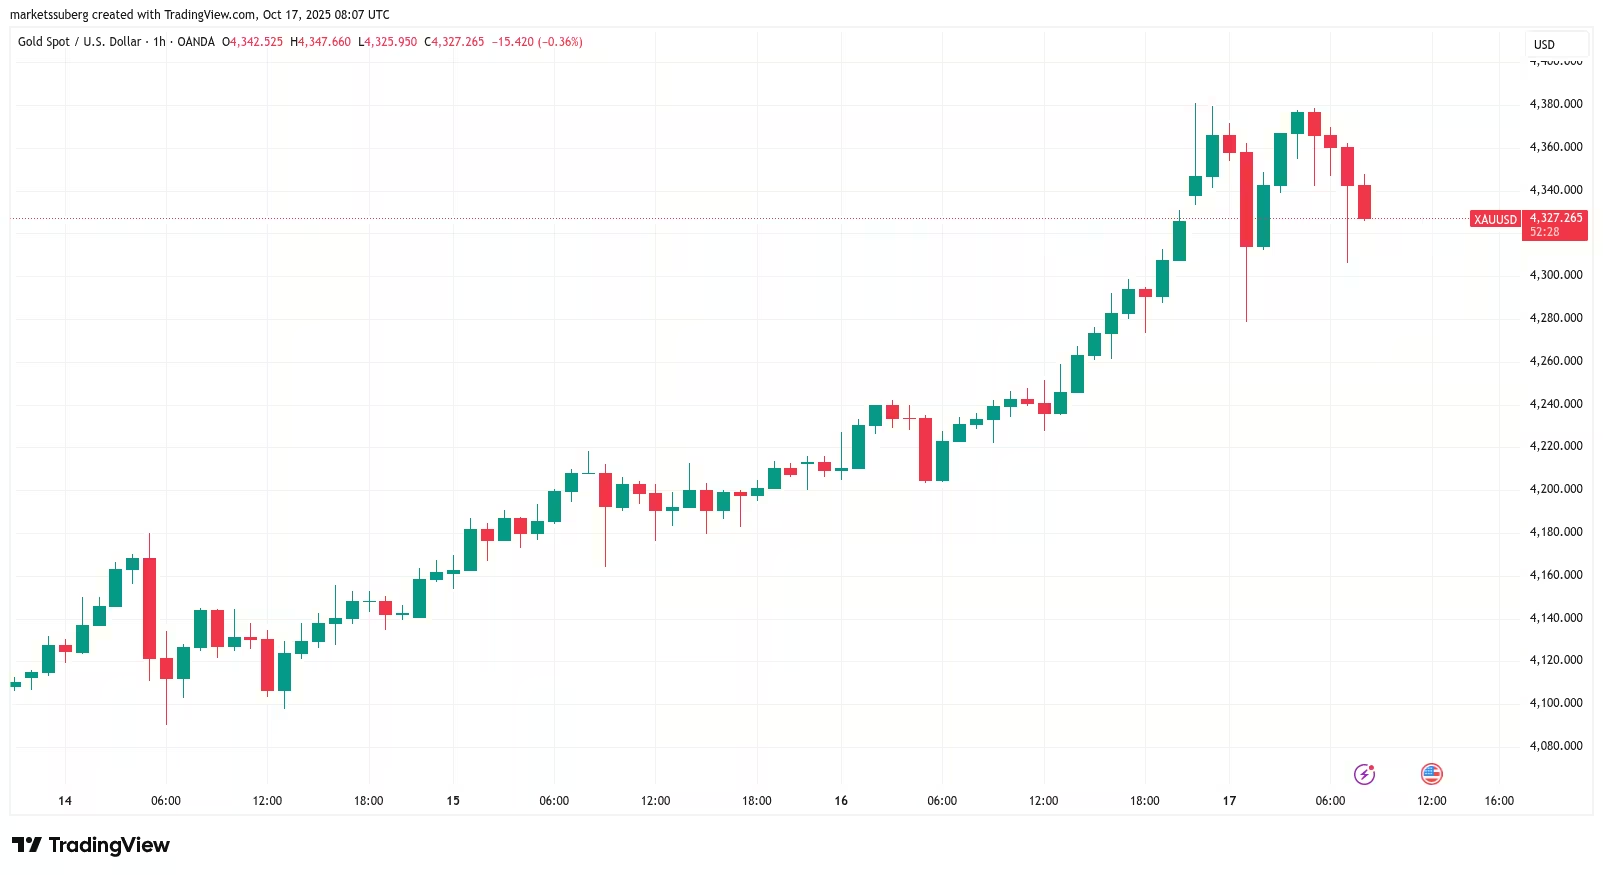
XAU/USD one-hour chart
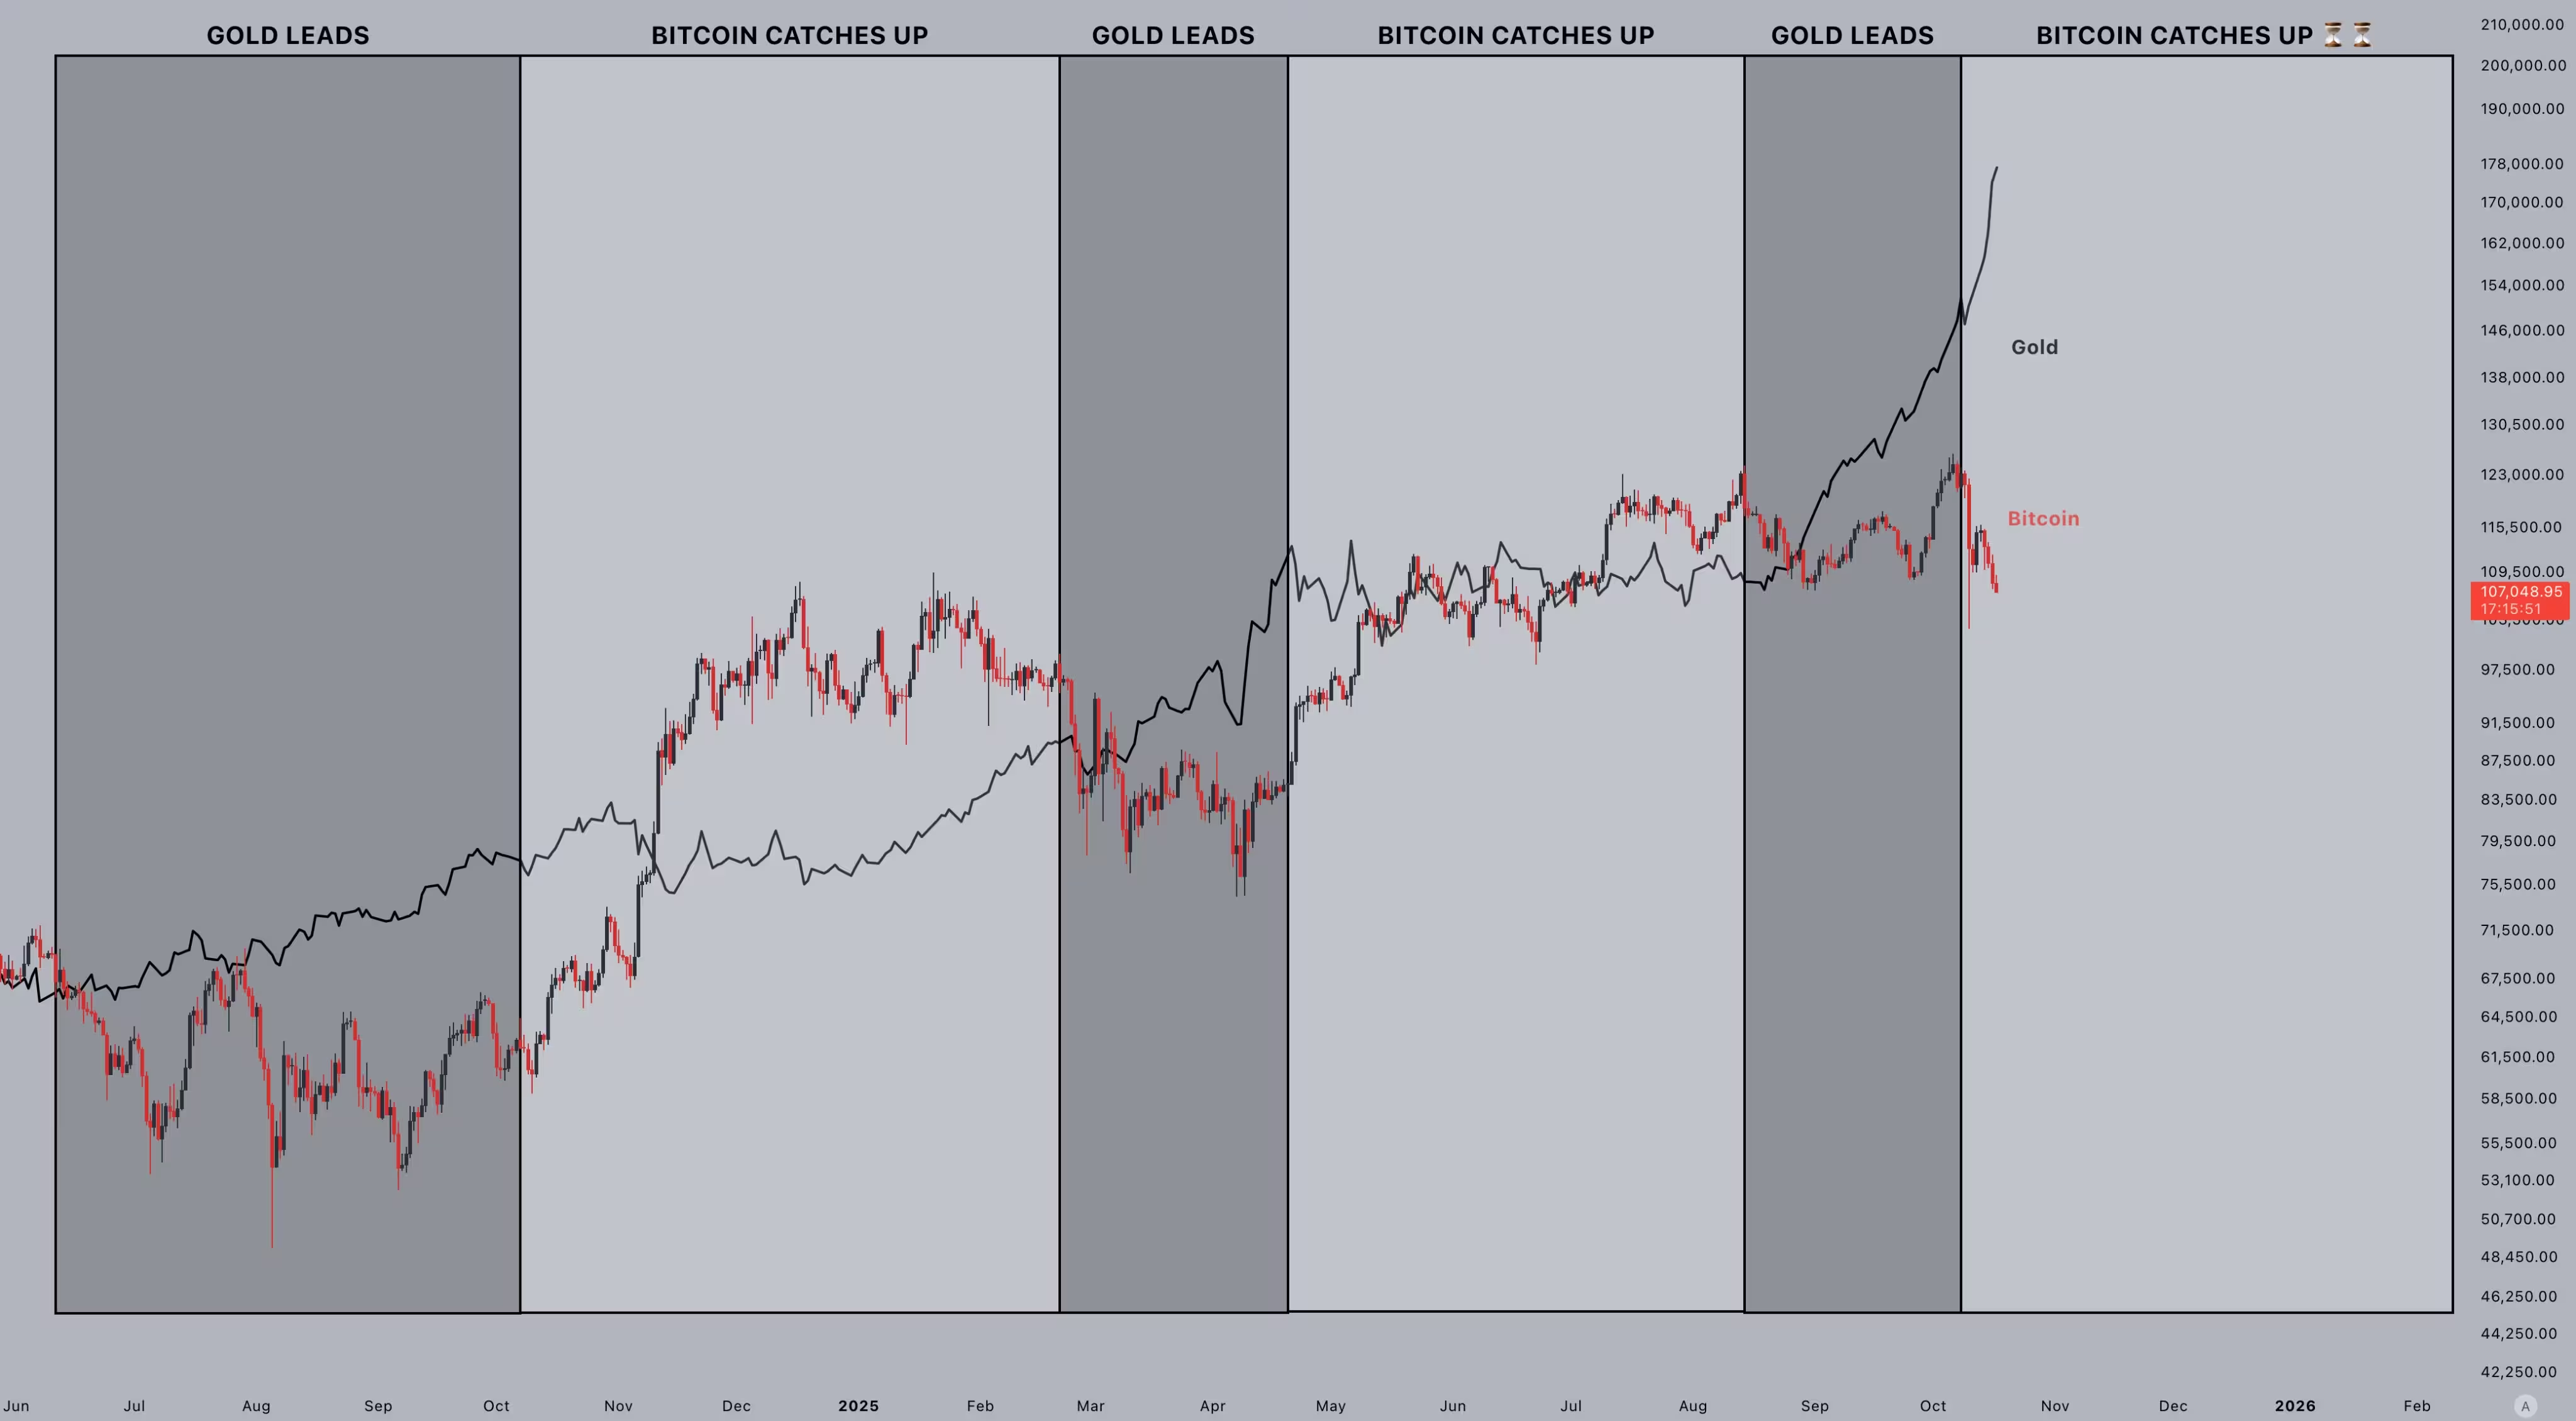
BTC/USD vs. XAU/USD chart
Market outlook and what traders should watch
Traders should monitor these key items: the $100,000 support level for Bitcoin, daily and weekly moving averages (notably the 50-week and 200-day MAs), regional bank equity performance, and macro headlines around US-China relations and liquidity measures. A sustained breakdown below $100,000 could accelerate a corrective phase for BTC and altcoins, while a recovery above $110,000 would improve the odds of a short-term rebound.
In an environment where blockchain projects and crypto markets remain sensitive to macro shocks, active risk management, position sizing, and clear stop-loss strategies are prudent for traders and investors navigating this volatile period.

“I cover automotive innovation, electric vehicles, and the future of mobility — where technology meets sustainability.”

Discussion
Leave a Comment