
Market snapshot: major losses across BTC and altcoins
The crypto market crash accelerated on Feb. 24 as Bitcoin slipped below the pivotal $65,000 support and edged toward its monthly low. BTC traded around $63,000 while major altcoins — Ethereum (ETH), Ripple (XRP), and Solana (SOL) — registered declines exceeding 4% in 24 hours. CoinMarketCap-tracked market capitalization fell roughly 4.23%, pushing the total to about $2.18 trillion.
Key drivers behind the sell-off
1. Risk-off sentiment dominates
Risk appetite waned across global markets this week, dragging crypto lower. The VIX index spiked more than 15% as U.S. equities dropped over 1%, prompting a rotation into traditional safe havens such as gold, which climbed toward record highs. Heightened geopolitical risk — notably the potential for military action in the Middle East — added fuel to the risk-off narrative. Traders are pricing in higher energy prices and inflation risks should conflict escalate, and Bitcoin has repeatedly failed to act as a consistent safe-haven asset during such risk events.
2. Macro headlines and tariffs
Recent U.S. tariff measures have also weighed on sentiment. A new 10% tariff on a broad range of imports under Section 122 went into effect, and additional tariff threats and probes are raising uncertainty for global trade, pressuring risk assets including crypto and technology stocks.
Market structure: technicals and futures
Weak futures open interest and ETF outflows
Futures open interest has declined, with CoinGlass reporting a drop to roughly $90 billion — a sign of weakening derivatives demand. Spot BTC ETF outflows accelerated, with Monday’s net outflows exceeding $203 million and cumulative spot Bitcoin ETF withdrawals surpassing $7 billion over the last four months. Ethereum ETF redemptions have also intensified, reducing liquidity and amplifying downside pressure on ETH.
Technical outlook for Bitcoin
Technically, Bitcoin broke down from a bearish pennant on the daily chart and now trades beneath major moving averages and the Supertrend indicator. These conditions raise the probability of further declines; a move toward $50,000 is plausible if downside momentum persists, which could trigger additional selling across altcoins.
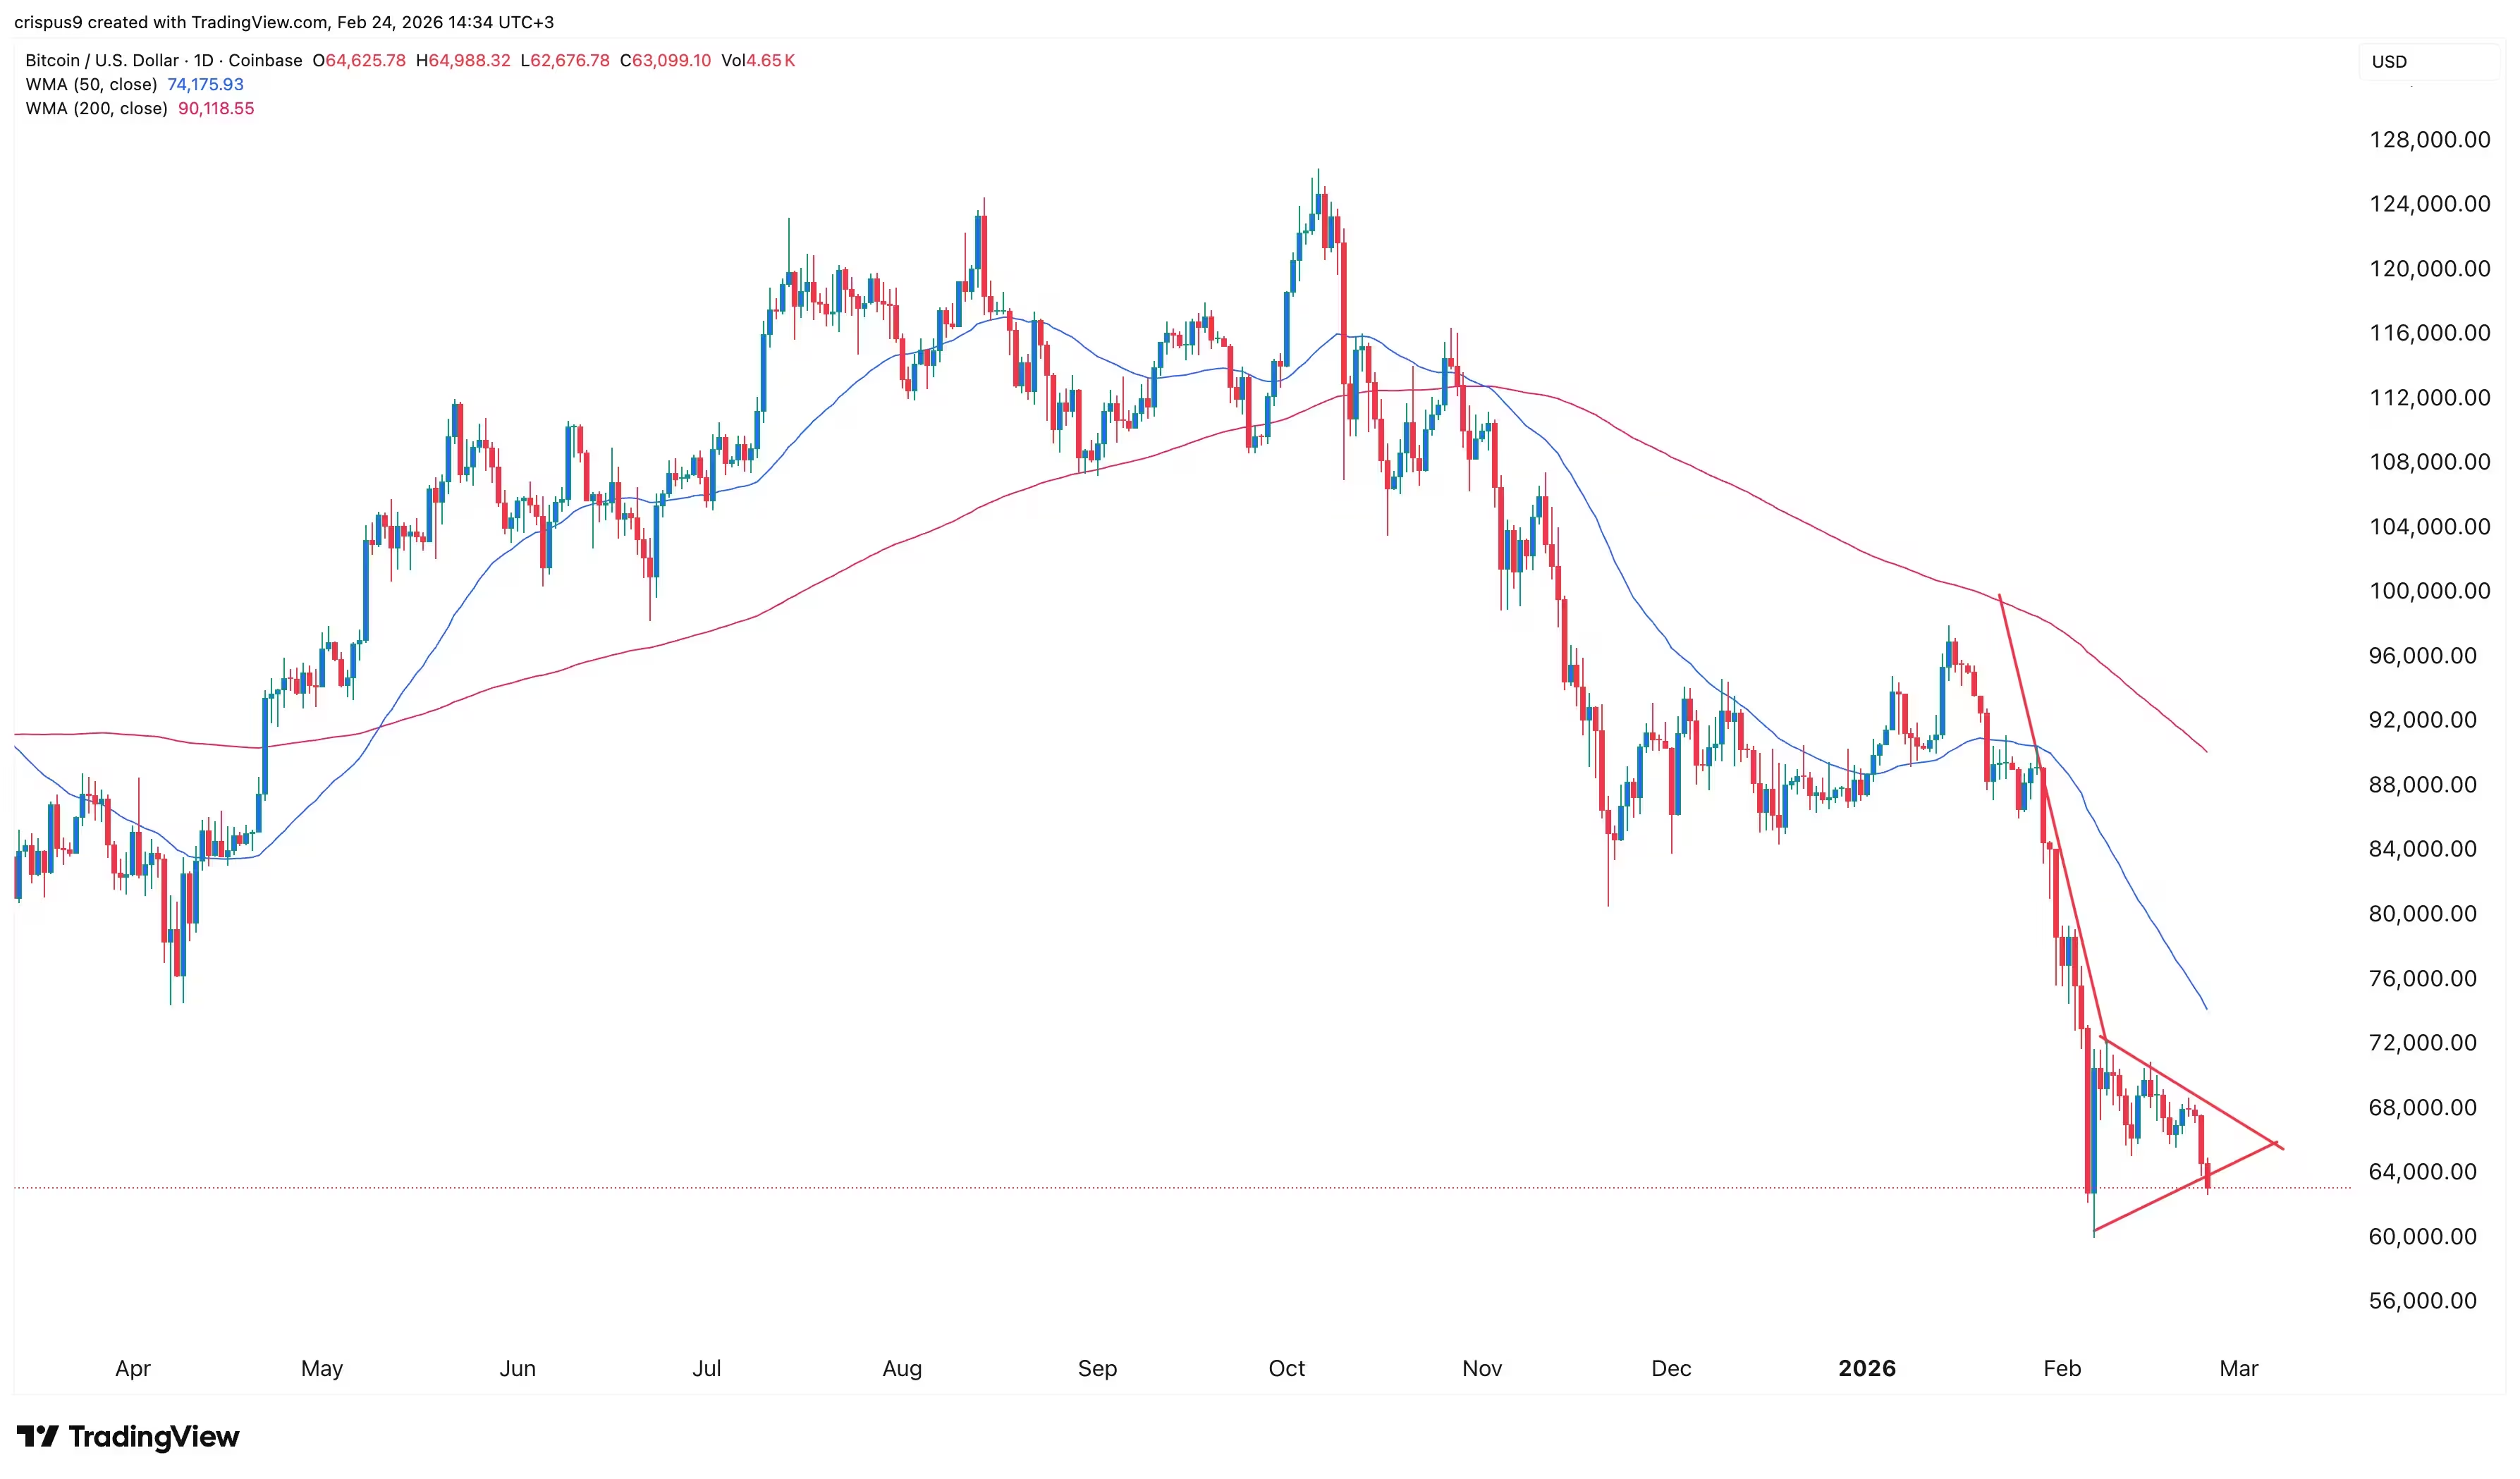
BTC price chart
Why this matters for traders and investors
Traders should monitor open interest, spot ETF flows, and macro risk indicators (VIX, gold, and energy prices) for early signs of stabilization or continued deterioration. For investors, the episode highlights the correlation between crypto and risk assets during periods of geopolitical or macroeconomic stress and underscores that Bitcoin and leading altcoins can remain vulnerable to liquidity shocks and outflows.
What to watch next
- ETF flows: sustained outflows could keep selling pressure elevated.
- Futures open interest: a rebound would signal renewed leverage and possible recovery.
- Macroeconomic headlines: any de-escalation in geopolitical tensions or clearer trade policy guidance could restore risk appetite.
In short, the Feb. 24 sell-off combined macro risk-off behavior, falling futures open interest, ETF outflows, and bearish technicals to push Bitcoin and major altcoins lower. Market participants should prepare for volatility and continue using risk management tools — position sizing, stop-losses, and diversified exposure — while tracking liquidity indicators closely.

“I cover automotive innovation, electric vehicles, and the future of mobility — where technology meets sustainability.”

Discussion
Leave a Comment