
Summary
Bitcoin is trading near $108,200 as of October 22, 2025, holding below recent highs and inside a tight consolidation range. Technical traders are watching for a potential golden cross on BTC's 3-day chart — a 50-period moving average crossing above the 200-period moving average — a signal historically associated with strong bullish momentum. A confirmed breakout above $115,000 could open a path to $125,000–$130,000, while a failure to defend the $107,000–$110,000 support band might drag prices back toward $100,000–$105,000.
Table of Contents
- Current Bitcoin price scenario
- Upside outlook for Bitcoin price
- Downside risks for BTC
- BTC price prediction based on current levels
Current Bitcoin price scenario
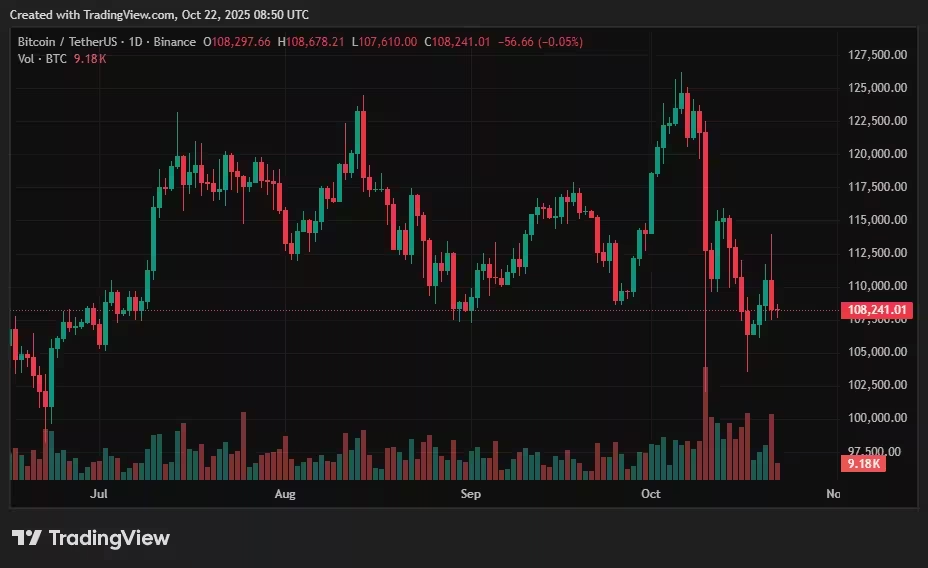
BTC 1d chart
Bitcoin has pulled back from the fresh all-time highs above $125,000 earlier this month after a volatility-driven liquidation event pushed the market down toward the low $100k area. Price is currently consolidating in a narrower band between roughly $107,000 and $114,000, with short-term resistance around $115,000. The $107,000–$110,000 zone has emerged as a critical support range where buyers have been stepping in to absorb selling pressure.
Market context
The move lower earlier in October removed a large amount of leveraged long exposure, and volume profiles indicate that participants are cautious but still receptive to buying around established support. Momentum indicators such as the Relative Strength Index (RSI) are recovering from neutral levels, and higher lows on shorter timeframes suggest a constructive bias so long as support holds.
Upside outlook for Bitcoin price
The primary bullish narrative centers on a potential golden cross on the 3-day chart — when BTC’s 50-period moving average crosses above the 200-period moving average on that timeframe. Historically, comparable crossovers have preceded extended rallies, which is why institutional traders and algorithmic models pay close attention to this setup.
What a confirmed golden cross could mean
If the crossover verifies with accompanying volume and sustained buying, it could trigger a new wave of inflows from institutional investors, particularly via Bitcoin ETFs and other regulated vehicles. A validated breakout above $115,000 with strong volume could shift price targets toward the $125,000–$130,000 range as momentum and sentiment align.
Macro tailwinds
Beyond technicals, macro factors could amplify upside. A softer U.S. dollar, dovish shifts in monetary policy, or renewed ETF accumulation would bolster the bullish case. Institutional adoption and consistent inflows remain key drivers of medium-term BTC price appreciation.
Downside risks for BTC
Despite the optimistic setup, risks are meaningful. The market could revisit the $100,000–$105,000 area if Bitcoin fails to hold the $107,000 support zone. False breakouts and phantom cross signals are common when momentum and volume don’t confirm technical patterns; a golden cross without supportive volume can be a bullish trap.
External threats
External macro or systemic events can quickly reverse risk appetite. A stronger-than-expected U.S. dollar, regulatory headwinds, geopolitical shocks, or sizable ETF outflows could undo gains and push BTC back into a deeper correction. The earlier flash crash that erased billions in leveraged positions is a reminder of how fragile price structure can be during volatile episodes.
BTC price prediction based on current levels
Near-term, BTC is likely to remain range-bound between $107,000 and $115,000 while traders look for confirmation of the golden cross and renewed buying momentum. The most probable bullish scenario is a sustained breakout above $115,000 with expanding volume, which could target $125,000–$130,000. Conversely, if the $107,000 support breaks decisively, a re-test of the $100,000 area becomes a high-probability event.
Key levels to watch
- Support: $107,000–$110,000 (critical short-term demand zone)
- Immediate resistance: $115,000 (breakout level)
- Upside targets: $125,000–$130,000 on confirmed breakout
- Downside target: $100,000–$105,000 if support fails
How traders should approach this setup
Risk management remains essential. Use position sizing and predefined stop levels when trading around potential breakouts. For long-term investors, focus on macro adoption signals such as ETF flows, on-chain metrics, and institutional accumulation rather than short-term noise. Momentum confirmation (volume and RSI behavior) and a verified golden cross on the 3-day chart should be treated as complementary signals, not guarantees.
Conclusion
Bitcoin is consolidating after a volatile stretch and stands at a technical inflection point. The possible 3-day golden cross is attracting attention because it can precede major rallies when supported by volume and institutional inflows. However, the path higher is not risk-free: losing the $107,000–$110,000 support range or a surge in negative macro events could push BTC back toward the low $100k area. For now, sentiment is cautiously bullish, and the next clear directional move will likely hinge on whether bulls can confirm the golden cross and sustain buying pressure above $115,000.
Note: This article is informational and not financial advice. Cryptocurrency markets are highly volatile — always do your own research and consider consulting a licensed financial advisor.

“I cover automotive innovation, electric vehicles, and the future of mobility — where technology meets sustainability.”

Discussion
Leave a Comment