
Solana spot inflows slump to six-month trough despite ETF debuts
Solana (SOL) has seen its spot inflows collapse to levels not seen in six months, underscoring cooling investor appetite after a brief post-ETF rally. Data from market trackers shows inflows dropping sharply to roughly $180.7 million, a dramatic decline from the prior-day surge that topped $885.02 million. The retrenchment comes even after two U.S.-listed Solana ETFs launched this week, which initially lifted demand and helped push SOL above the $200 mark for a short period.
Solana inflows have fallen to a six-month low at $180.7 million on Oct. 31
Exchange flows shift toward outflows
Exchange ledger activity provides additional context to the slowdown. Net outflows for SOL increased notably on major venues, indicating more tokens are being routed into exchanges — often a precursor to selling pressure — rather than being withdrawn to custody or long-term wallets. Binance posted the largest single-exchange net outflow at approximately $52.89 million, while OKX recorded about $26.98 million. Other top platforms such as Coinbase and Bybit have also shown elevated outflow metrics.
Within the last 24 hours, inflows were limited: Bitstamp registered $1.19 million and Kraken reported $501,160 of SOL inflows, while most liquidity is exiting centralized venues.
ETF hype fades — daily ETF inflows tumble
The initial investor enthusiasm for U.S. Solana ETFs — led by Bitwise Solana Staking ETF and Grayscale’s SOL-backed product — produced a meaningful short-term spike in capital into SOL-related products. At launch, combined daily net inflows into the new funds exceeded $110 million. However, SoSoValue data indicates that daily ETF flows have since cooled to approximately $37.33 million, signaling a shift back toward established ETFs tied to Bitcoin and Ethereum.
This rotation suggests some investors may be treating the new Solana ETFs as a short-term trading vehicle rather than a long-term allocation, while others are reallocating into more liquid, larger-cap crypto ETFs.
Price action: SOL retreats after failing to hold $200
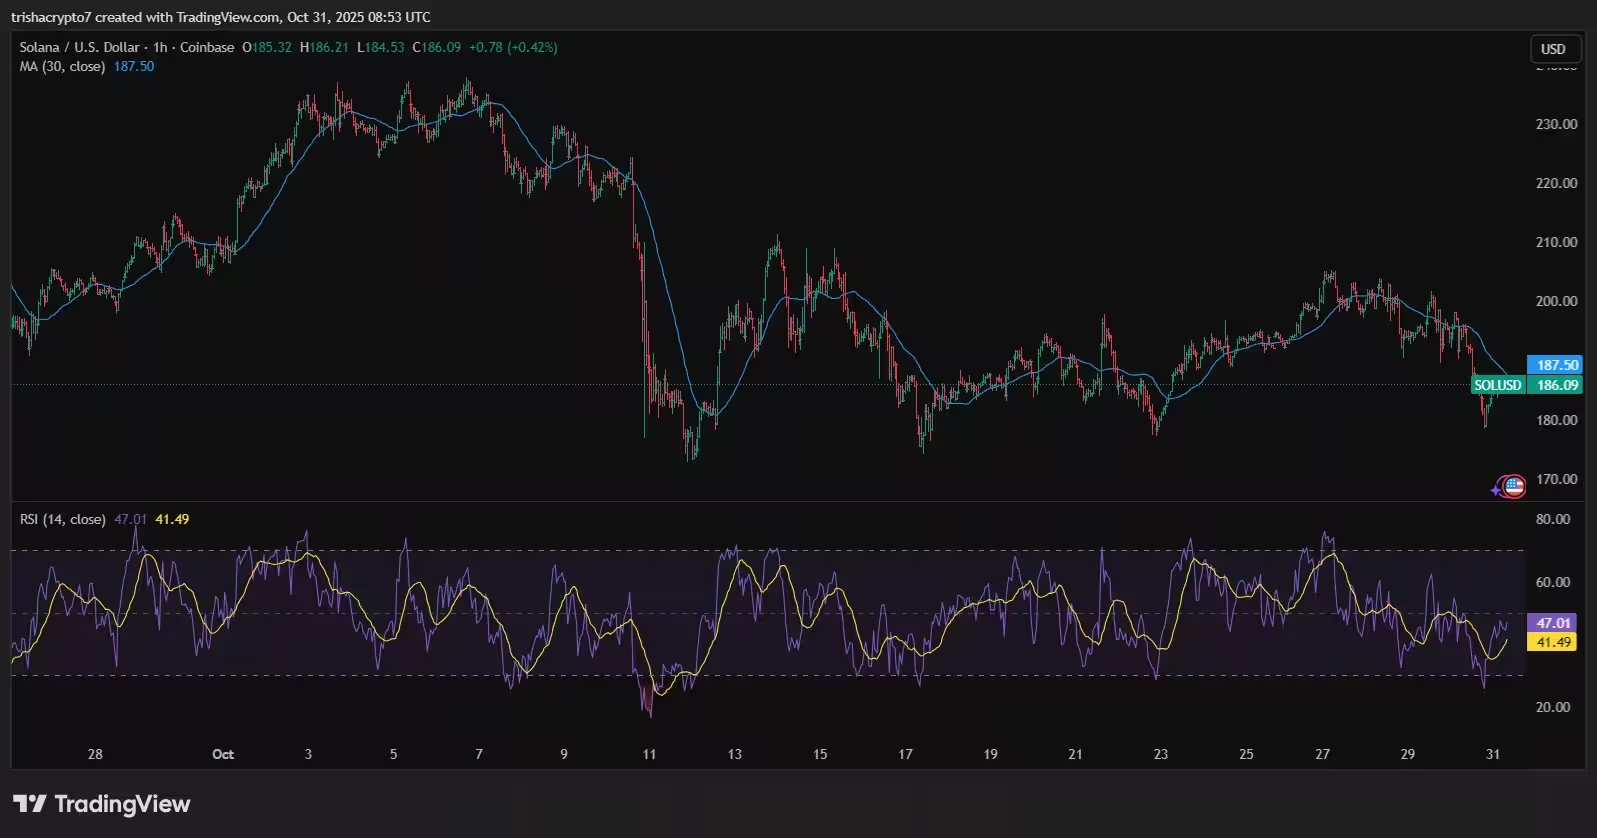
SOL’s price momentum weakened rapidly after the failed attempt to maintain $200. The token is trading near $186, down roughly 4.7% over 24 hours and sitting marginally below its 30-day moving average around $187.50. The moving average has flipped from support to resistance — a key technical sign that the short-term trend has turned bearish.
Solana has fallen below its 30-day moving average zone | Source: TradingView
Momentum indicators also paint a cautious picture. The Relative Strength Index (RSI) is hovering around 47, below the neutral 50 threshold, and has been forming lower highs — indicative of decreasing buying interest even during brief rebounds. Additionally, the Chaikin Money Flow has dropped, signaling that liquidity and large-scale accumulation have waned.
Unless bulls can reclaim and hold the $190–$195 zone with fresh volume, SOL appears vulnerable to a retest of lower support levels near $180 and potentially the $172 area.
Why inflows matter and what to watch next
Spot inflows and ETF flows are important barometers of demand and liquidity in crypto markets. High inflows typically reflect new capital entering an asset class, while outflows — especially when concentrated across major exchanges — can precede price declines. For SOL, the current combination of shrinking spot inflows, fading ETF momentum, and exchange outflows raises the probability of short-term consolidation or deeper pullbacks.
Key on-chain and market signals to monitor:
- ETF daily flows (SoSoValue): any reversal to sustained positive inflows could restore buying pressure.
- Exchange balances: continued net outflows to exchanges may increase sell-side pressure.
- Moving averages and RSI: a decisive reclaim of the 30-day MA and an RSI move back above 50 would improve the technical outlook.
- Volume: meaningful upticks in on-chain and exchange volume are needed to validate any rally attempt.
Outlook for traders and long-term investors
Traders should treat the current environment as short-term bearish until structural indicators improve. Momentum traders might watch for a confirmed break below $180 to target the next support zone, while swing traders could look for volume-backed reversals above $195.
Long-term investors should differentiate between temporary market noise and fundamentals: Solana’s ecosystem remains active with ongoing development and staking utility, but macro liquidity conditions and ETF rotation dynamics can materially impact price in the near term. Investors considering accumulation may prefer a staged approach, focusing on dollar-cost averaging and clear risk-management rules.
Bottom line
Solana’s drop in spot inflows to $180.7 million, paired with rising exchange outflows and weakening technical indicators, reflects a cooling market following the initial ETF-driven surge. Until SOL can reclaim the $190–$195 range with renewed volume, the path of least resistance looks lower, with potential tests of $180 and $172. Market participants should monitor ETF flows, exchange balances, moving averages, and momentum indicators for clearer directional signals.
Keywords: Solana, SOL, spot inflows, ETFs, liquidity, exchange outflows, Binance, OKX, Coinbase, Bybit, Bitstamp, Kraken, moving average, RSI, Chaikin Money Flow, crypto markets, price support, resistance.

“I cover automotive innovation, electric vehicles, and the future of mobility — where technology meets sustainability.”

Discussion
Leave a Comment