
Solana under pressure as $150 support is tested
Solana (SOL) is under renewed selling pressure as it hovers close to the $150 support area. After sliding from roughly $188, SOL extended weekly losses to more than 20%, reflecting broad weakness across the crypto market. With Bitcoin dipping below $100,000 and total market capitalization shrinking by hundreds of billions, Solana’s technical outlook has shifted toward bearish territory.
Market context: macro and crypto dynamics
The recent pullback in SOL is not an isolated event. Liquidity and risk appetite have weakened across digital assets, pushing many top altcoins lower in tandem with Bitcoin. The market-wide decline has increased correlation among major tokens, meaning Solana’s price action is heavily influenced by BTC moves and overall crypto volatility. Traders are watching macro indicators and on-chain flows closely for signs of stabilization before committing to new long positions.
Technical picture: key levels to watch
Technically, Solana fell through its weekly $175 support and tested lower levels near $147 before buyers reappeared around $150. The token remains below its 200-day moving average, a long-used indicator for medium-term trend direction, and is trading inside a descending parallel channel that has governed price action since September. These conditions make upward moves more difficult, while any relief rallies are likely to meet resistance at prior support zones.
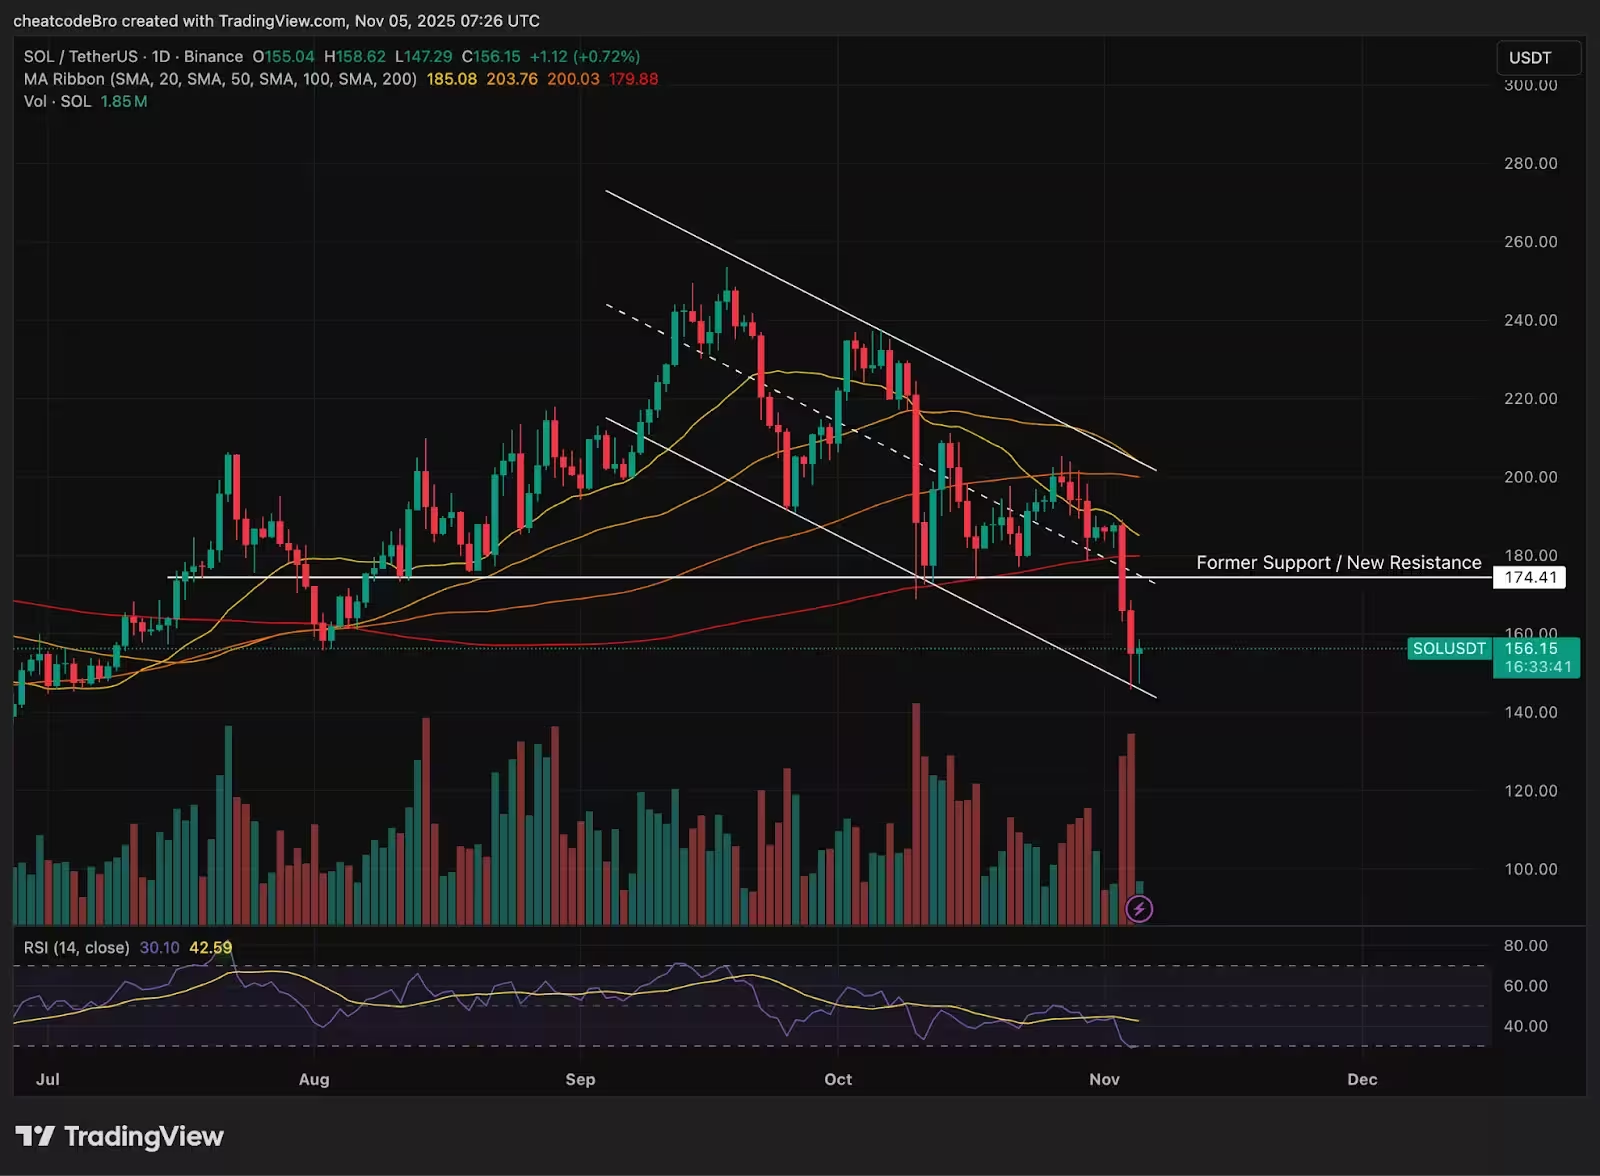
Solana price chart
Immediate support and resistance
The $150 area is the immediate line in the sand. If buyers can defend this zone, a period of consolidation could follow, potentially allowing SOL to attempt a recovery toward $175. However, if $150 breaks decisively on increased selling volume, the next downside targets could come into play and investor confidence may be further eroded. On the upside, $175–$188 represents the most meaningful resistance corridor in the near term.
Scenarios: bearish, neutral, and bullish outlooks
Bearish: Continued negative sentiment across the crypto market could push SOL below $150, accelerating the downtrend and prompting stop-loss cascades that would draw price to lower structural supports.
Neutral: Solana holds $150 and trades sideways for several sessions, allowing selling pressure to ease and volume to normalize. In this case, SOL might retest $175, but strength would be required to overcome the 200-day moving average.
Bullish: A broad-based market rebound led by Bitcoin could lift Solana above $175 and retake the descending channel’s midline. Renewed buying would need confirmation in volume and sustained closes above key moving averages to change the midterm bias.
What traders should consider
Risk management is essential in the current environment. Traders should monitor Bitcoin price action, overall market capitalization, and on-chain metrics such as exchange flows and active addresses. Confirmation of stability—lower volatility, rising volume on up days, and successful retests of support—will be necessary before many investors shift from defensive to opportunistic positions in SOL.
At present, caution remains the prudent approach as Solana fights to maintain the $150 support while facing stiff resistance near $175.

“I cover automotive innovation, electric vehicles, and the future of mobility — where technology meets sustainability.”

Discussion
Leave a Comment