Solana price slips toward $150 as broader crypto sell-off deepens
Market snapshot
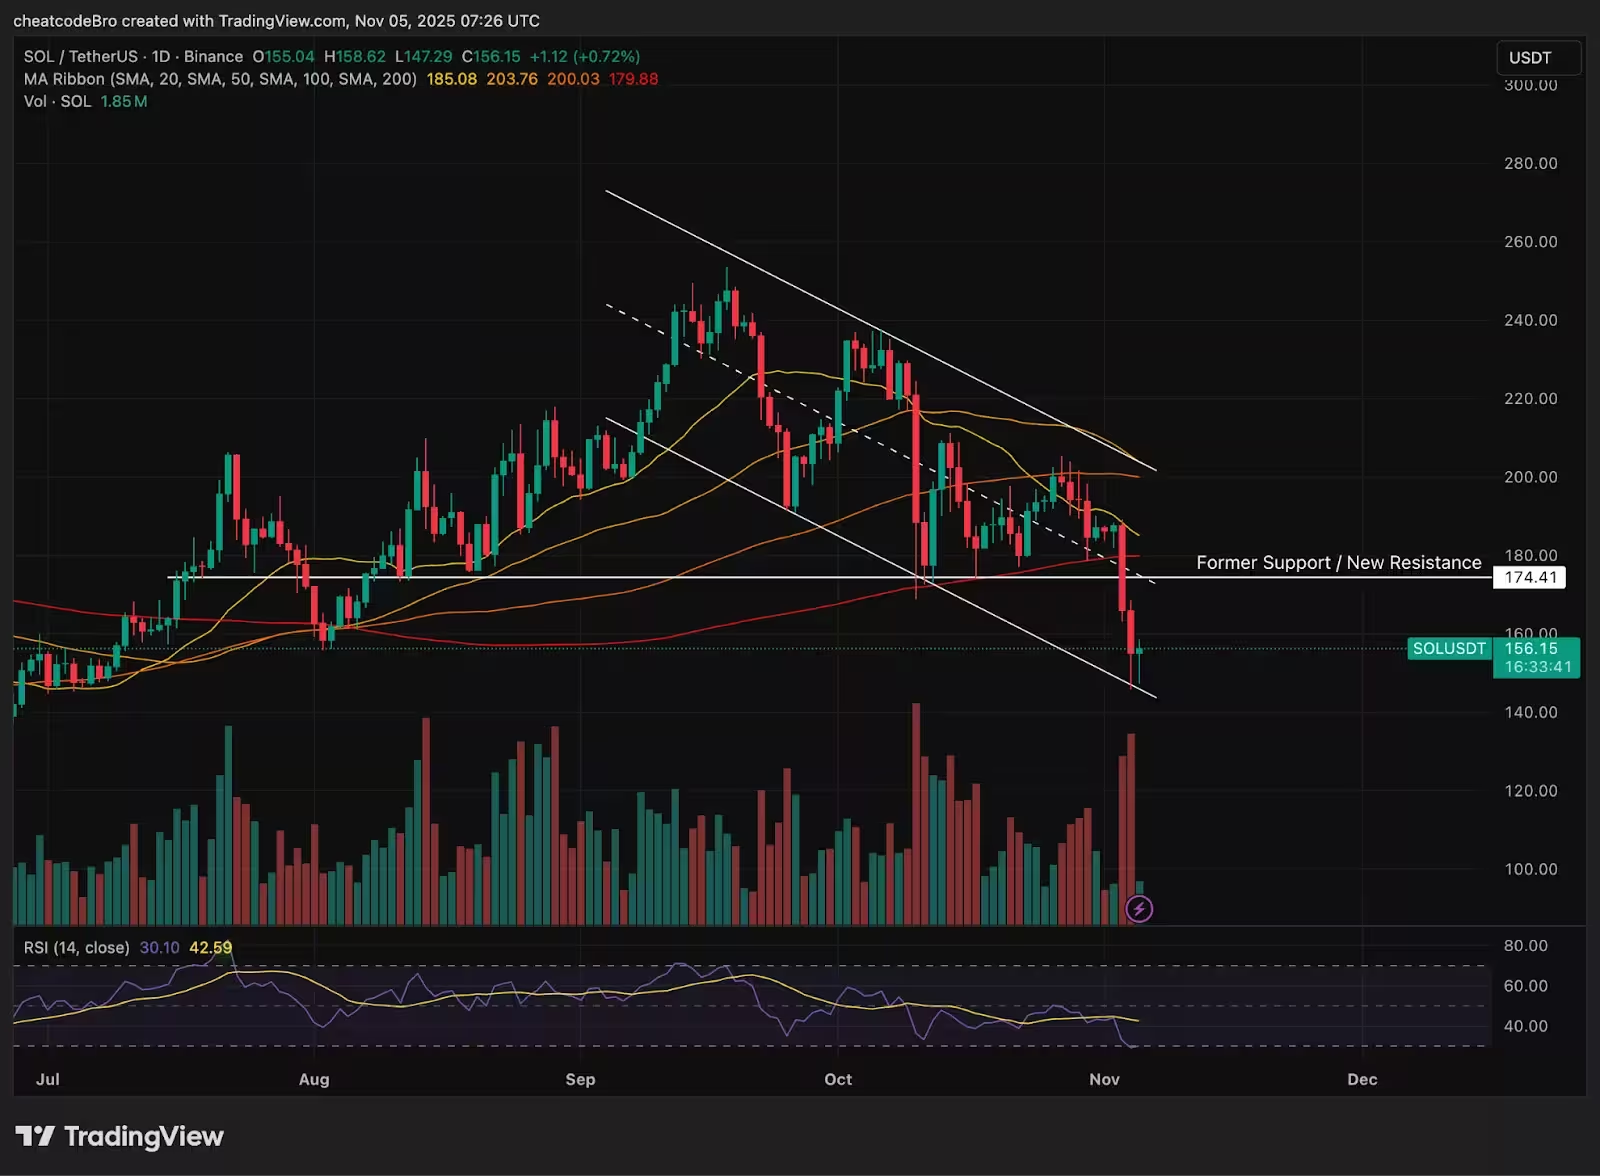
Solana (SOL) is trading near $157 after a steep sell-off that has wiped out much of the token’s recent gains. Daily losses sit just under 1%, while weekly declines have reached approximately 22% as selling pressure intensified from the $188 area. The move coincides with a broader market drawdown, with Bitcoin dipping below the $100,000 mark and total crypto market capitalization falling by roughly $300 billion.
Technical context: support, resistance and trend channels
Solana’s fall accelerated earlier in the week when the token broke the $175 weekly support and slid as low as $147 before buyers reappeared near $150. The token now trades below its 200-day moving average, a key long-term technical indicator that increasingly tilts the midterm bias toward bearish.
Solana price chart
Since September, SOL has been moving inside a downward parallel channel, consistently testing the channel’s upper and lower bounds. The recent dip landed SOL at the channel’s lower boundary, where the $150 zone has emerged as a short-term support. If selling persists, this support could give way, opening the door to lower price levels and heightened volatility.
Market sentiment and headwinds
The decline in SOL is not isolated — it mirrors widespread weakness across altcoins amid risk-off sentiment. With Bitcoin vulnerability weighing on liquidity, traders are more likely to sell into any brief bounce, reinforcing nearby resistance levels. The $175 area, which previously provided support, now looks poised to act as a stiff barrier for any recovery attempt.
Institutional flows and margin-driven liquidations continue to shape price action. Large-scale liquidations during sharp moves tend to exacerbate downside momentum, while a lack of fresh buying interest delays meaningful rebounds. Until volatility subsides and confidence returns, the market’s reaction to brief recoveries will be a key determinant of SOL’s trajectory.
What could happen next
Bear case: If negative market sentiment persists and Bitcoin remains under pressure, SOL could revisit $150 and potentially fall below that level, testing lower channel support and prompting additional selling. This scenario would further dent investor confidence and could extend the token’s weekly losses.
Bull case: A stabilization in overall crypto markets or a bounce in Bitcoin could allow SOL to consolidate near the $150–$175 band. If buyers regain control and SOL clears the $175 resistance convincingly, the token could attract renewed interest and attempt a more sustainable recovery toward previous highs.
Key levels to watch
- Support: $150 (critical short-term support and lower channel boundary)
- Resistance: $175 (recent weekly support turned resistance)
- Longer-term trend: 200-day moving average (currently above the price, acting as resistance)
For traders and investors, risk management is essential. Watch overall market liquidity, headline risk, and Bitcoin price behavior — these factors will heavily influence whether SOL stabilizes or experiences further downside.

“I cover automotive innovation, electric vehicles, and the future of mobility — where technology meets sustainability.”

Discussion
Leave a Comment