
Solana rallies toward $140 as ETF demand deepens
Solana (SOL) is trading near the $140 threshold as steady institutional buying from spot Solana ETFs reshapes the token's near-term outlook. With $53.08 million in ETF inflows recorded on Nov. 25 and a 21-day streak of net purchases, SOL’s market dynamics are increasingly driven by institutional allocations rather than short-term retail churn.
Key market snapshot
SOL changed hands near $139, up roughly 1.4% over the prior 24 hours and approaching the upper bound of its seven-day trading range ($124.09–$144.01). Despite the recent uptick, SOL remains under pressure on the monthly and long-term frames, about 31% lower over the past month and roughly 52% below its January all-time high near $293. Short-term spot trading volume slipped to $4.92 billion (down 12.3%), while derivatives activity showed a mixed picture: futures volume eased 1.17% to $18.34 billion and open interest held around $7.13 billion. Those figures suggest traders are not aggressively adding fresh leveraged positions after recent volatility.
Institutional inflows spotlight: Spot Solana ETFs
Spot Solana ETFs have been the clearest driver of demand. Data from SoSoValue shows net inflows of $53.08 million on Nov. 25, with Bitwise’s BSOL leading at $30.9 million. Grayscale’s GSOL added $15.9 million, while Fidelity’s FSOL and VanEck’s VSOL contributed $4.8 million and $1.33 million, respectively. Cumulatively, spot SOL ETFs have amassed roughly $621 million since late October, marking the longest uninterrupted inflow streak for a major crypto ETF in 2025.
This durable buy-side pattern contrasts with outflows in some Bitcoin and Ethereum products and appears to be anchoring liquidity around Solana. Franklin Templeton’s recent Form 8-A filing to register a Franklin Solana ETF — a final step before potential NYSE Arca listing — may add further demand if approved and listed as early as Nov. 26.
Solana co-founder Raj Gokal called the steady inflows “greatly underappreciated,” a view echoed by researchers at LVRG who say the ETF purchases are creating a rebuilding support floor that could stabilize price as liquidity returns.
Technical picture: compression into a critical range
Technical indicators show SOL pressing into a narrowing price zone created by a descending resistance line from October’s lower highs and a rising support trend that has formed higher lows since mid-November. This wedge-like compression often precedes a decisive directional move.
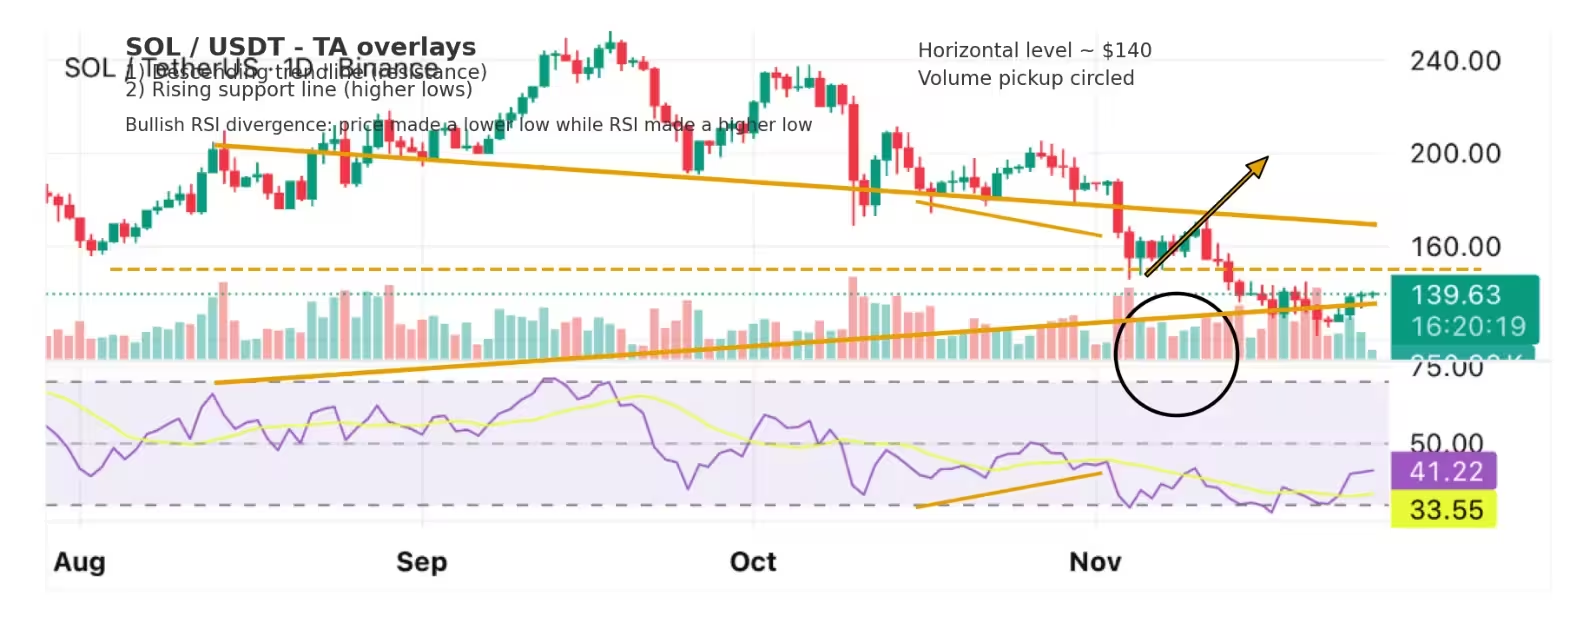
Solana daily chart
Momentum metrics are signaling tentative strength: the relative strength index (RSI) has lifted from oversold territory and produced a bullish divergence, while the MACD and short-term moving averages are beginning to turn up. However, longer-term averages remain above the current price, indicating SOL is still carving out a base inside a broader downtrend.
Levels to watch
$140 is the immediate pivot: a clear hold above this zone would open the path toward $150 and then the heavier resistance cluster around $160. Conversely, failing to sustain $140 could re-expose the $128–$130 support band. A deeper break below those levels would increase the likelihood of a move into the $118–$120 area, particularly if ETF inflows cool or market sentiment deteriorates.
What this means for traders and investors
For traders, the consolidation around $140 creates defined risk-reward setups: a successful breakout could offer momentum-driven entries, while a rejection would make range support levels attractive for shorter-term buyers. Long-term investors should monitor ETF inflow trends and institutional adoption signals, as continued net purchases by spot products tend to reduce market sell pressure and can establish durable demand floors.
On-chain activity, exchange flows and ETF subscription patterns will be crucial to track in the coming sessions. If inflows persist and the technical compression resolves to the upside, SOL could reclaim higher price territory; if inflows ebb and derivatives positioning increases, downside vulnerability will rise.
Overall, Solana’s near-term trajectory appears increasingly tied to institutional appetite via spot ETFs—making ETF flows and the $140 technical threshold essential indicators for the next meaningful move in SOL price.

“I cover automotive innovation, electric vehicles, and the future of mobility — where technology meets sustainability.”

Discussion
Leave a Comment