
Bitcoin's Bollinger BandWidth hits record low — a bullish echo
Bitcoin (BTC) is showing a classic volatility pattern that historically precedes sharp upside moves. The Bollinger BandWidth — the percentage gap between the upper and lower Bollinger Bands used to gauge volatility — has compressed to all-time lows on the monthly chart. That rare squeeze has previously marked the beginning of fast, parabolic rallies for BTC, fueling hopes that a similar surge could unfold again before year-end.
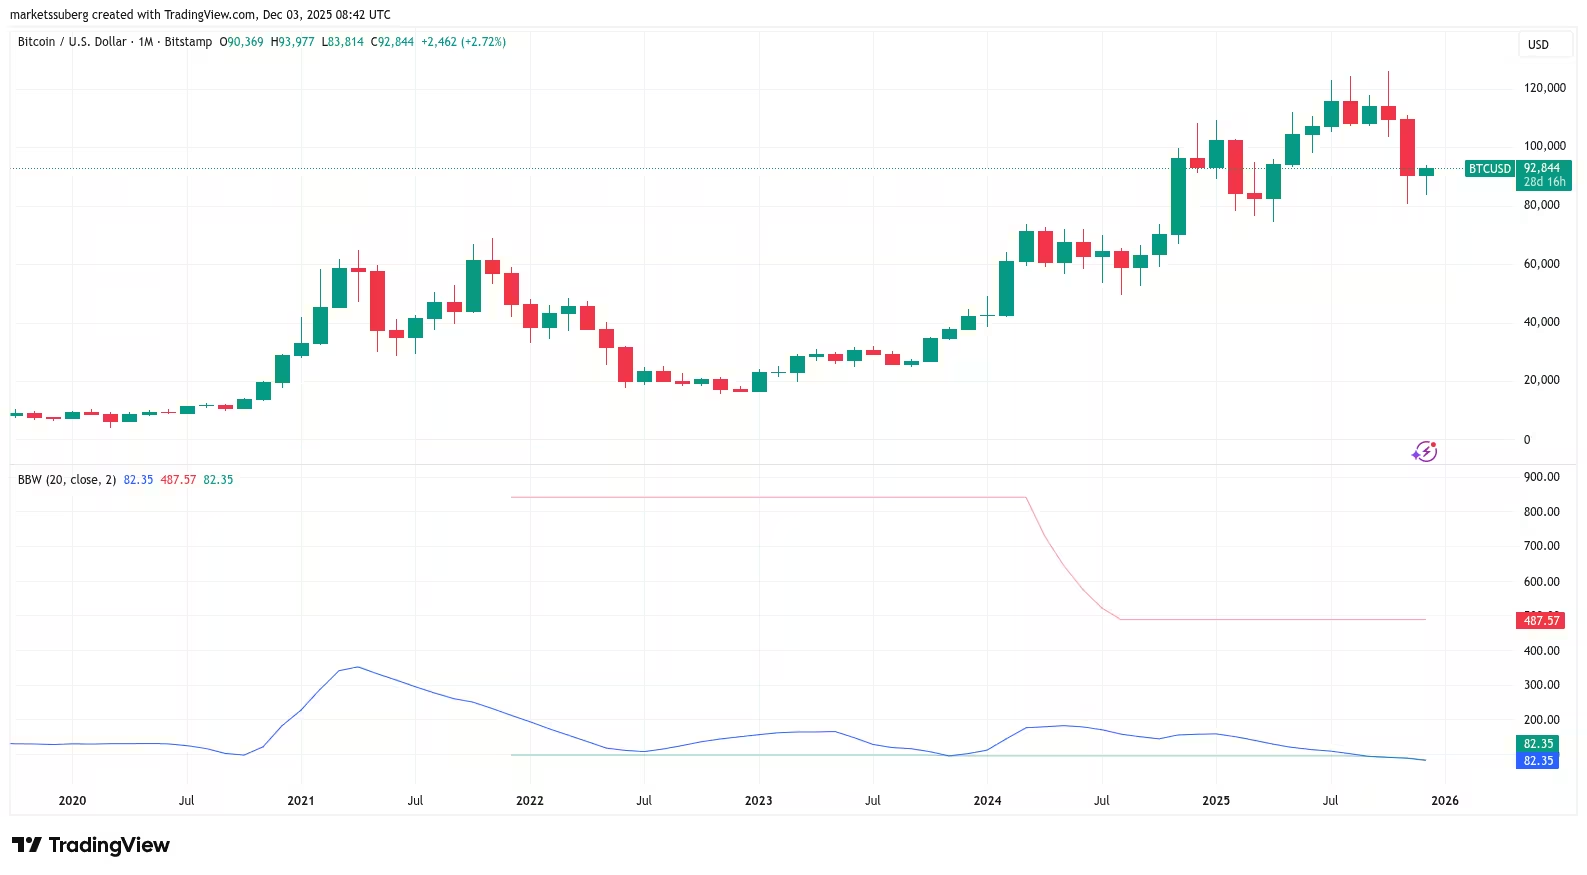
BTC/USD one-month chart with Bollinger BandWidth data
Why this matters for BTC price and volatility
When Bollinger BandWidth tightens, it signals low volatility and a buildup of market energy. Historically, each deep BandWidth trough has been followed by abrupt directional moves. On prior occasions, a “green” BandWidth signal coincided with a strong BTC price rebound — most notably the November 2023 trigger that preceded a roughly 40% advance over the next four months. Market participants are watching closely to see whether history repeats and if Bitcoin stages a similar parabolic leg higher.
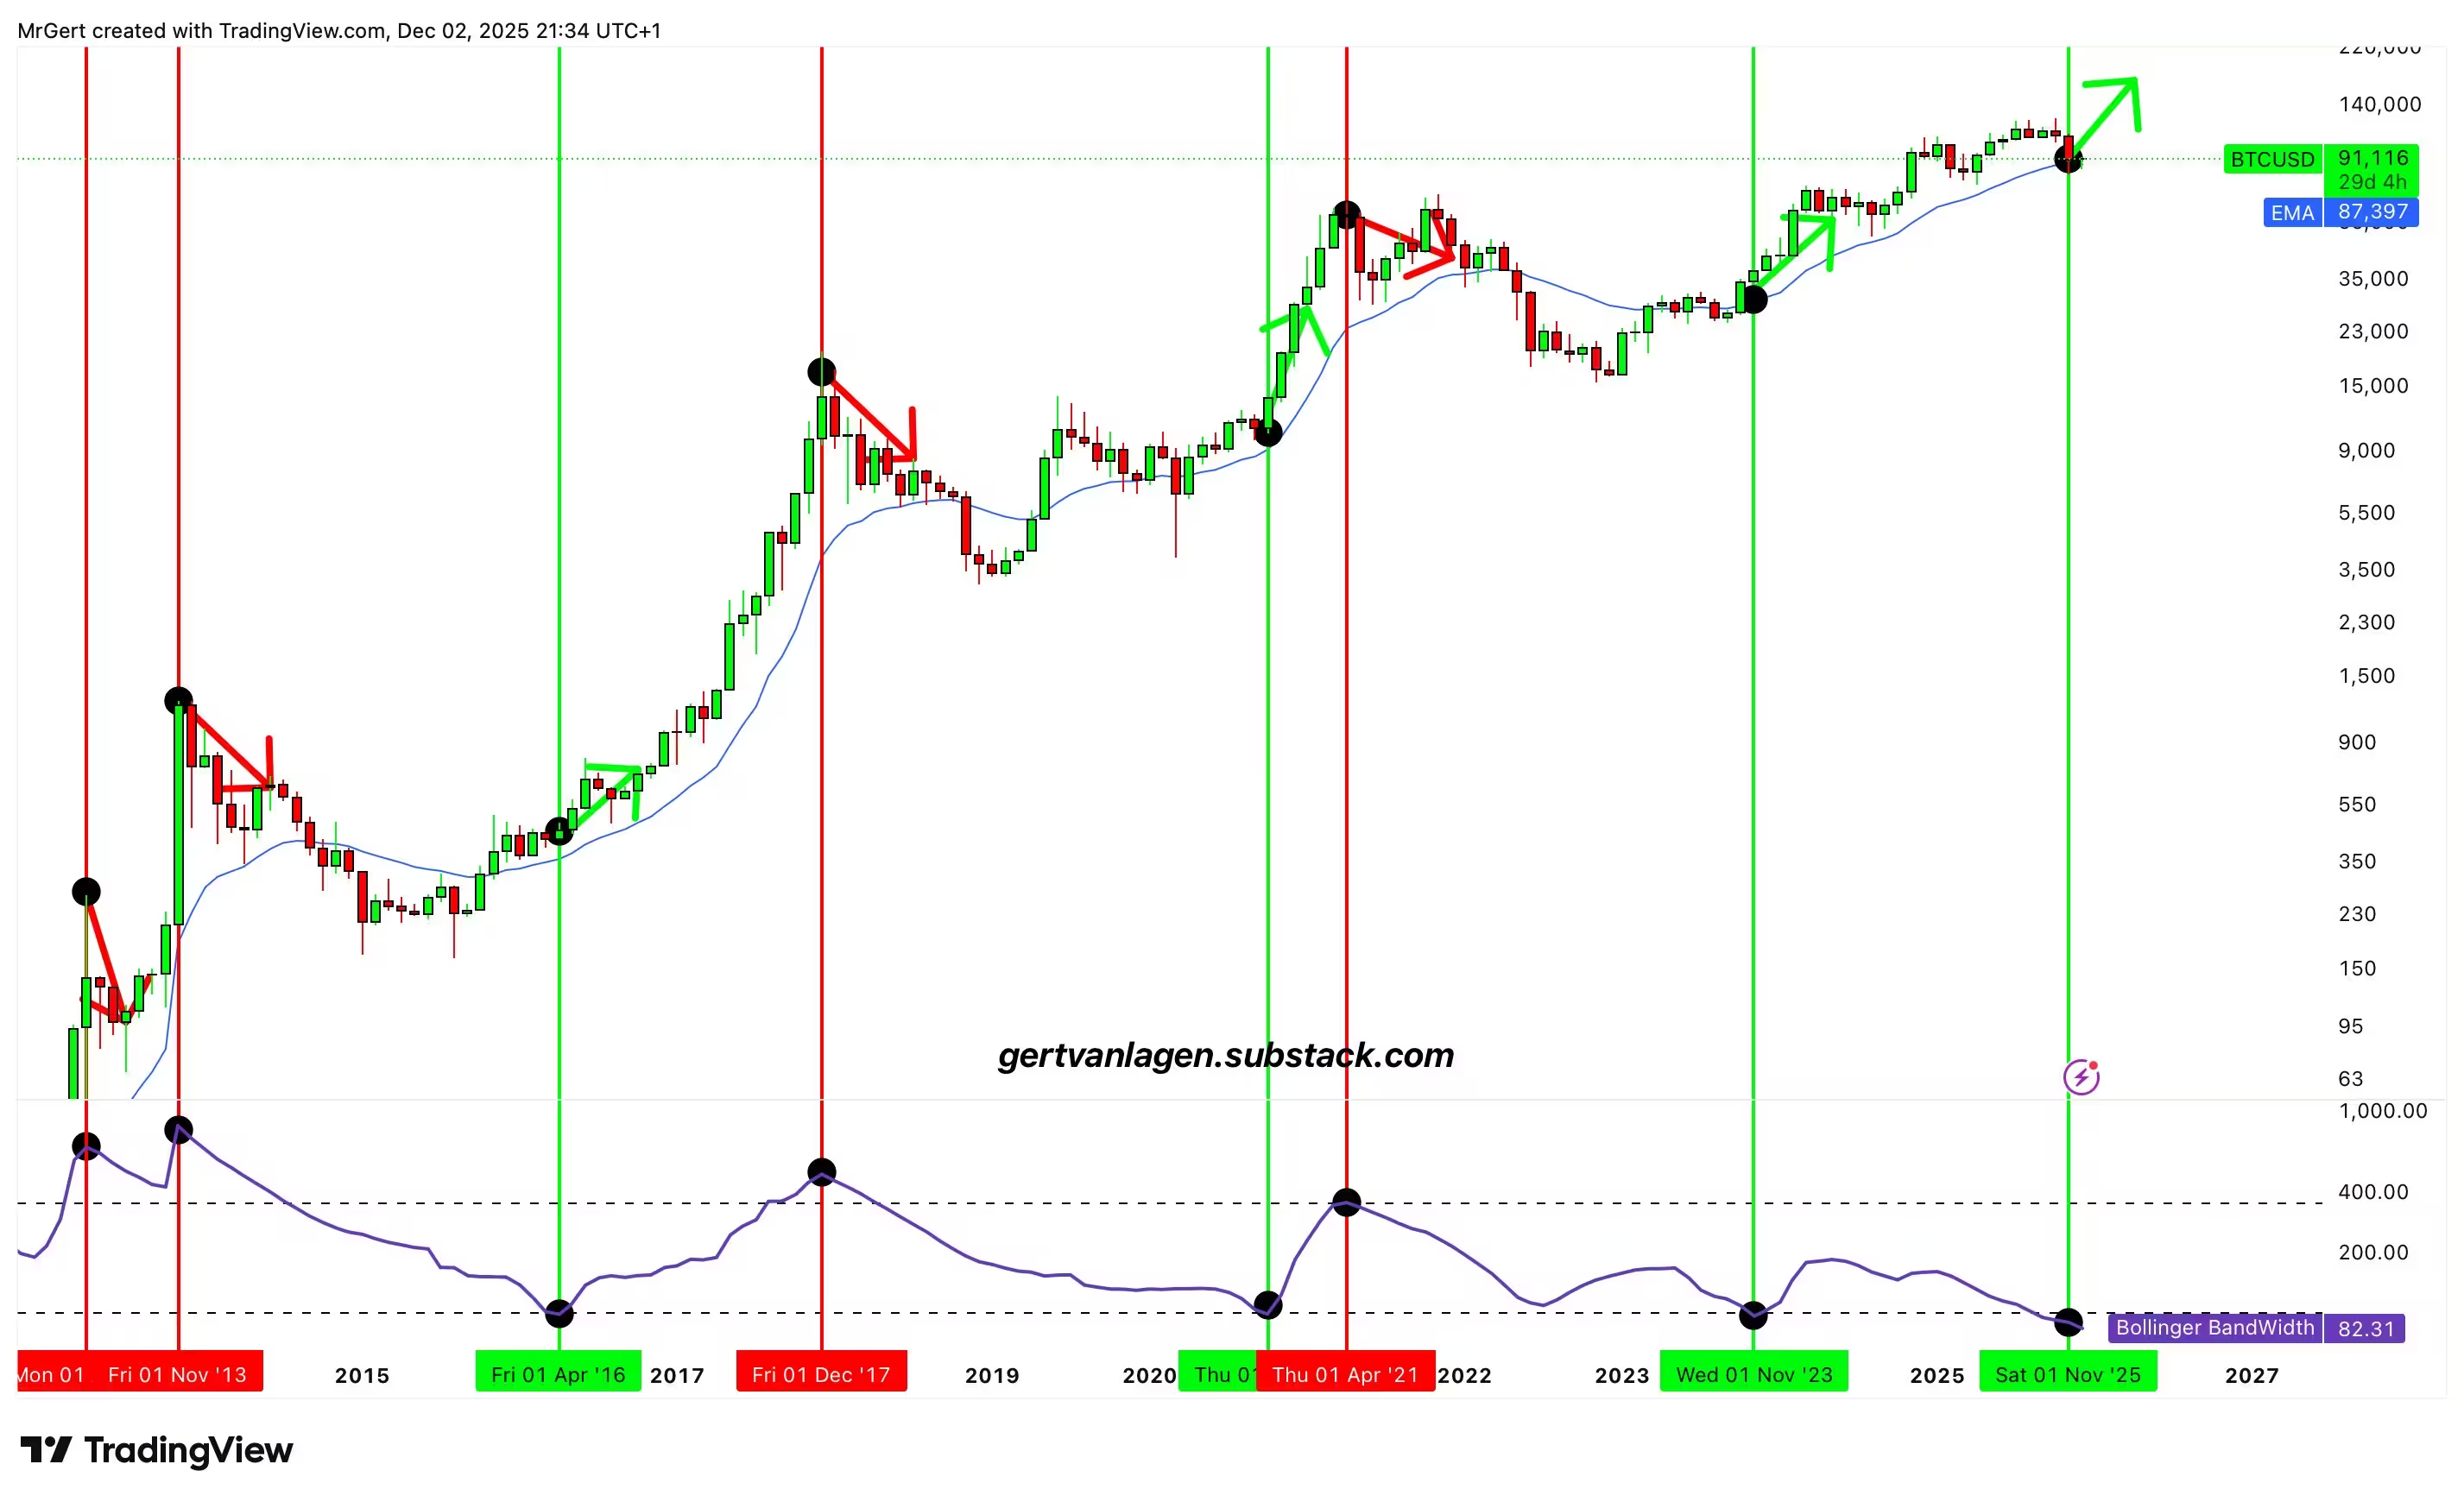
BTC/USD one-month chart with Bollinger BandWidth data
Analyst perspectives: parabolic move or false start?
Macro strategist Gert van Lagen highlighted the monthly BandWidth signal, noting that every historical instance produced a sharp, parabolic leg up for BTC. He compared the setup to pre-blowoff patterns in other markets, where a cascade of lower highs in Bollinger BandWidth eventually breaks and gives way to high-timeframe bearish volatility. Van Lagen’s view anticipates a final push to new highs before a subsequent bear market consolidation.
Traders remain cautious despite the signal
Not all traders are convinced. Short-term indicators and market structure matter: low trading volume, the need for daily MACD/RSI resets, and prior rapid price drops all argue for caution. Some traders characterize the current action as a simple breakdown-and-retest until BTC proves it can sustain higher levels. On the upside, a reclaim and hold above the current price zone would strengthen the bullish case.
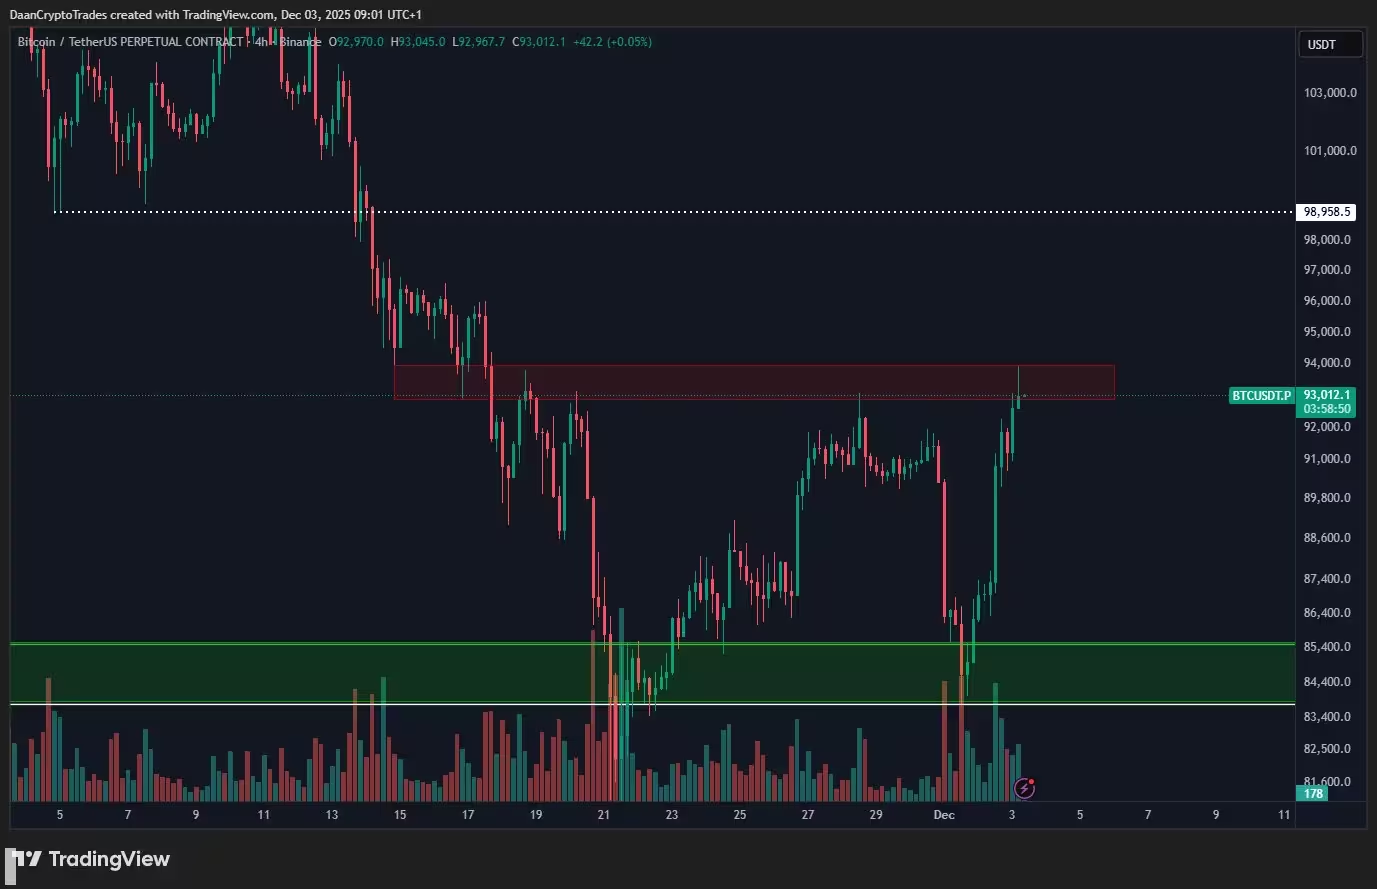
BTC/USDT perpetual contract four-hour chart
Key technical levels and the year-end narrative
Sentiment has been further influenced by macro rumors, including speculation around a pro-crypto U.S. Federal Reserve chair. BTC touched two-week highs near $94,000 as these headlines circulated. Technically, market structure showing higher highs and higher lows on the relevant timeframe would be a positive sign. Traders are also focused on the 2025 yearly candle level — around the $93,500 Four Year Cycle threshold — which could influence end-of-year positioning if BTC can close above it.
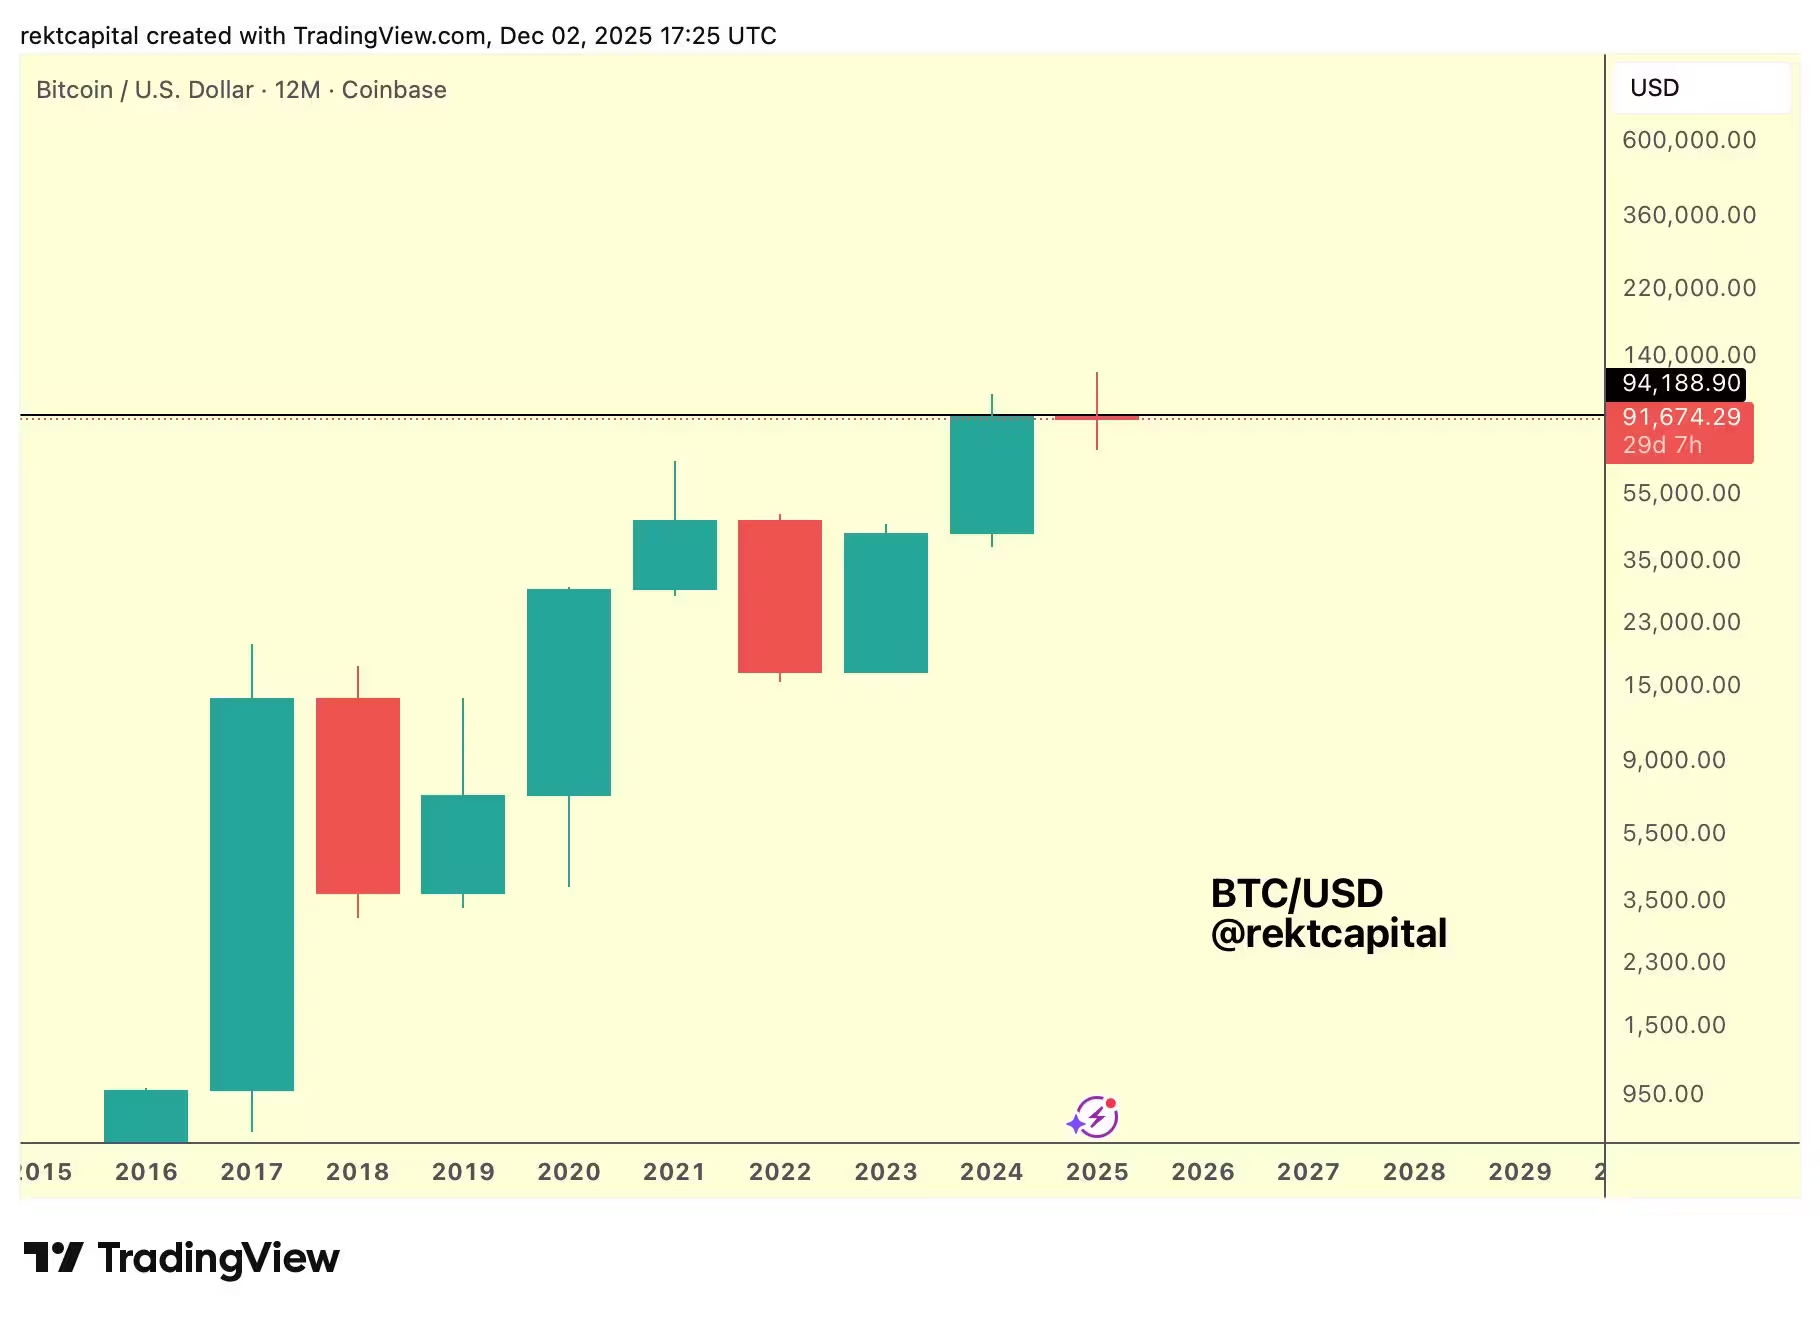
BTC/USD 12-month chart
What traders should watch next
Short-term participants should monitor band compression and breakout confirmations. Look for: a sustained close above the critical price zone, improving volume and momentum on MACD/RSI, and how BTC reacts around the $93,500 yearly reference. If BandWidth follows its historical pattern and the market secures a clean breakout, Bitcoin could accelerate into a parabolic move. Conversely, failure to hold support or a re-tightening of volatility could mean more consolidation before any major trend continuation.
Overall, the Bollinger BandWidth squeeze offers a compelling, data-driven bullish hypothesis for Bitcoin, but traders demand price confirmation, stronger volume, and resilient momentum to commit to a full-fledged parabolic call. For market observers, the current setup blends technical tradition with macro catalysts — a recipe that could deliver outsized BTC price moves in the coming weeks.

“I cover automotive innovation, electric vehicles, and the future of mobility — where technology meets sustainability.”

Discussion
Leave a Comment