
Market snapshot
Bitcoin (BTC) is trading near $122,000 after a brief dip toward $120,600, signaling a modest cooldown following its push to fresh all-time highs. The recent multi-day surge — part of the so-called "Uptober" momentum — saw BTC climb from roughly $119,000, breach key resistance, and top $126,000 before price action tightened and volumes declined.
Why the pullback matters
After rapid gains driven by elevated spot buying and strong Bitcoin ETF inflows, the market is in a consolidation phase. Profit-taking remains subdued according to on-chain trackers, which suggests holders are not aggressively selling into strength. That dynamic can reduce downside pressure, but cooling momentum and lower trade volumes mean near-term price direction will likely depend on whether key support levels hold.
Technical outlook
BTC’s daily chart shows a classic double bottom formation, which traders often interpret as a bullish reversal pattern when confirmed. In this cycle, Bitcoin rebounded from a support area around $108,000, pushed above the neckline and ultimately recorded the most recent all-time high. If BTC maintains levels above $120,000, the chart projection from the double bottom points to higher targets in the $127,000–$137,000 range.
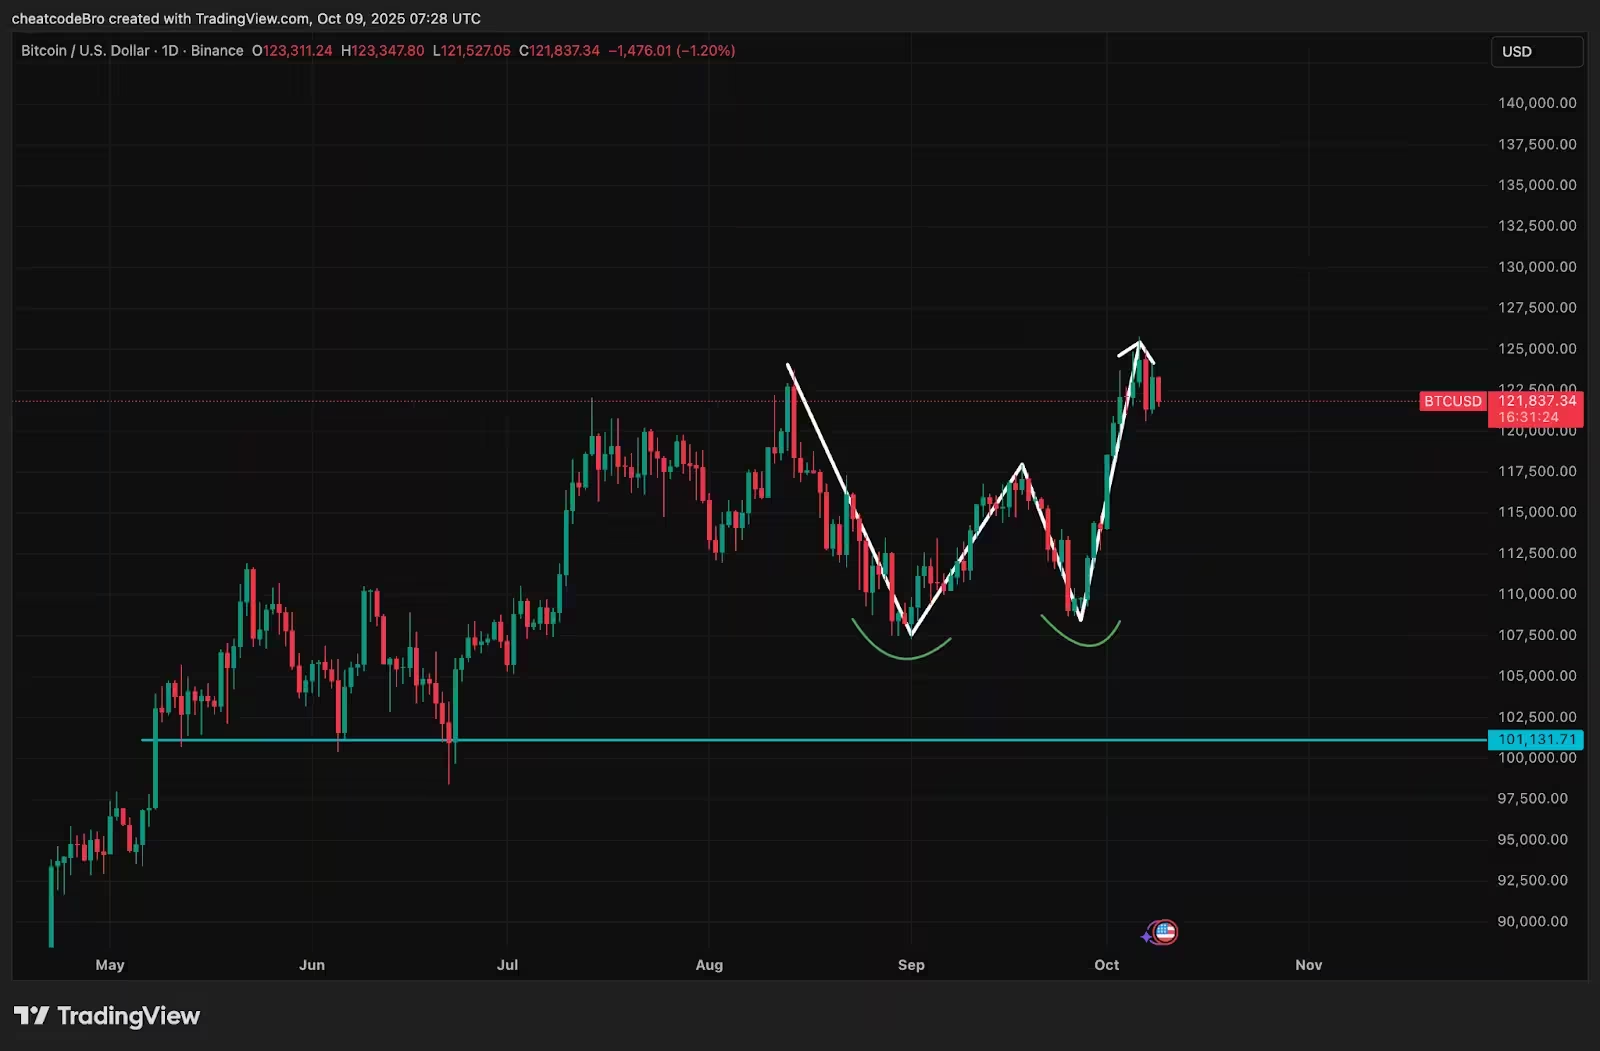
Bitcoin price chart
Double bottom signal
The double bottom is meaningful because it identifies two similar lows followed by a decisive move above the neckline. Confirmation of the pattern increases the probability of continuation to measured targets. Traders watching for entries will look for sustained closes above nearby resistance and improving volume on advances to validate the bullish thesis.
On-chain flows and ETF impact
Record ETF inflows and persistent spot buying have been central to the recent rally. Industry data providers have highlighted continued inflows — including sizable daily figures that reinforced institutional and retail demand. Meanwhile, on-chain metrics such as low realized profit-taking imply that most holders remain patient, which historically supports prolonged rallies rather than quick reversals.
Key levels to watch
Support: $120,000 is the immediate psychological and technical floor. A decisive break below this level on rising volume could open the door to deeper retracements toward earlier support zones.
Resistance: Near-term upside hurdles sit around $125,000 and the prior high at $126,000. If bullish momentum returns and BTC reclaims these zones on stronger volume, the pattern targets near $127,000–$137,000 become relevant.
Outlook for traders and investors
For traders, the consolidation offers defined risk setups: long positions can be sized with stops below $120,000, while bulls may scale into positions on confirmed breakouts. Longer-term investors should monitor ETF flow trends and on-chain indicators such as exchange balances and realized profit to gauge whether buying pressure is sustainable. Overall, the technical structure and subdued profit-taking favor a continuation scenario, provided $120,000 holds as support.
As always, market conditions can change quickly. Investors and traders should combine technical analysis, on-chain data, and macro context when making decisions in this volatile market.

“I cover automotive innovation, electric vehicles, and the future of mobility — where technology meets sustainability.”

Discussion
Leave a Comment