
Bitcoin outlook: new $76K and $50K targets emerge
Bitcoin is showing fresh downside momentum as the daily chart prints a classic bear flag pattern, prompting new price targets near $76,000 and $50,000. Growing bearish divergences on key indicators and limited upside strength have traders warning of an extended correction for BTC.
Why traders see a deeper correction
Leading voices in the crypto trading community point to RSI and MACD divergences on longer timeframes as the primary technical signals underpinning the bearish thesis. One professional analyst, Roman, told followers to expect roughly a 17% decline from recent local lows, arguing that the current upward-sloping channel is behaving like a relief bounce inside a broader downtrend.
Roman highlighted that macro tailwinds lifting equities and hopes for lower US interest rates have so far failed to translate into crypto strength. He referenced Bitcoin's massive 750% rebound from the 2022 bear-market low around $15,600, but concluded that 'the bull run is over' for the present cycle and recommended preparing for a future bull market that may resume near the $50K area.
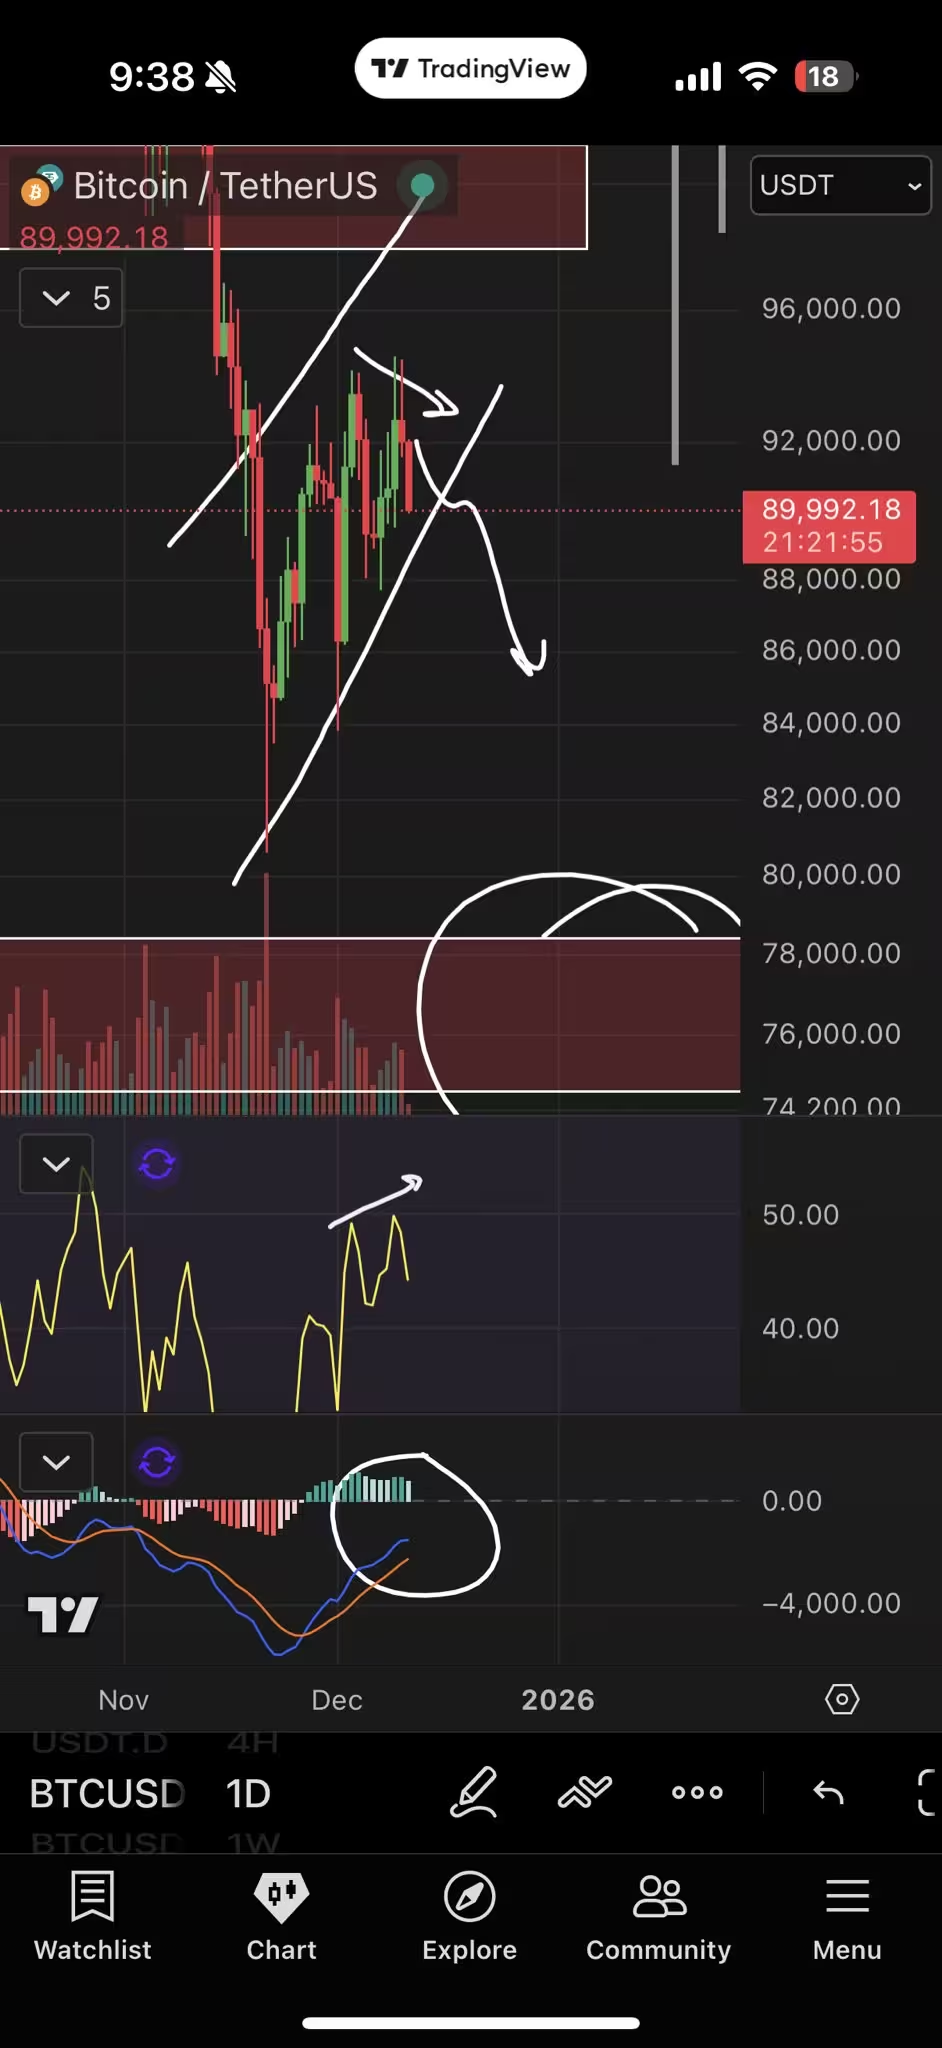
BTC/USD one-day chart
Bearish case supported by historic parallels
Other traders observed similarities to the 2022 cycle. Analyst Ted Pillows and others noted that if the pattern repeats, markets could briefly surge toward six figures before a sharp correction back below $70,000. Such patterns — a pump followed by a dump — are consistent with the bear-flag scenario: a short-lived rally that ultimately precedes lower lows.
Bulls cling to the support band
Not all analysts are convinced the correction will accelerate. Some traders point to Bitcoin's bull market support band as a potential safety net. Formed from the 21-period simple moving average (SMA) and the 20-period exponential moving average (EMA), this band has historically provided bounce opportunities during corrective phases.
Trader Luca noted that BTC is attempting a fourth consecutive daily candle above that band. If BTC can convincingly hold and bounce from the support band, the mid-term outlook could flip back to bullish, negating some of the bear-flag risk.

BTC/USD one-day chart
Technical indicators to watch
Traders are monitoring several indicators that will influence whether the bear flag resolves to the downside or the price reclaims bullish momentum:
- RSI on daily and weekly frames for sustained bearish divergence
- MACD crossovers and histogram behavior for momentum confirmation
- Price interaction with the 21 SMA / 20 EMA bull market support band
- Volume trends on spot and derivative markets, including exchange flows

BTC/USD one-day chart with bull market support band
What this means for traders and investors
Short-term traders should manage risk tightly while watching for confirmation of a breakdown under the bear flag. Longer-term holders may see the $50,000 target as an opportunity to accumulate if macro conditions remain favorable. Regardless of horizon, the market's next moves will be dictated by how price interacts with the support band and whether bearish divergences resolve in favor of sellers.
As always, combine technical analysis with macro and on-chain data before making trading decisions. Bitcoin's path remains volatile, and both upside rejections and deeper corrections are plausible outcomes in the coming weeks.

Discussion
Leave a Comment