
Ethereum dips under $3,000 as spot ETH ETFs record outflows
Ethereum slipped below the critical $3,000 psychological level on Tuesday as U.S. spot Ethereum ETFs posted a third consecutive day of net outflows. The broader crypto market adopted a risk-off tone ahead of key U.S. economic data, pressuring ETH and other leading digital assets.
ETF outflows accelerate
Data from SoSoValue showed nine spot Ethereum ETFs registered $224.7 million in net outflows on Monday, Dec. 15 — the largest single-day withdrawal since Nov. 21. BlackRock’s IBIT led the redemptions with about $139 million exiting the fund; Grayscale’s ETHE followed with roughly $35 million, and another Grayscale ETH product lost about $20 million. None of the listed ETH ETFs reported inflows on the day.
That single-day figure extended a three-day streak of outflows totaling nearly $286.5 million. The ETF complex has remained net-negative for December, continuing a downtrend from the prior month when these funds shed roughly $1.42 billion. These persistent ETF outflows are a clear near-term headwind for ETH price and market sentiment.
Market snapshot and price action
Ethereum briefly fell to $2,895 before settling around $2,929 at the time of reporting, down more than 6% in 24 hours. The $3,000 area had acted as robust support multiple times in recent weeks; its breach triggered stop-losses and amplified selling pressure.
A wave of liquidations in highly leveraged futures positions intensified the drop. CoinGlass data indicates roughly $207 million in long ETH positions were liquidated, contributing to total crypto market liquidations of about $658.8 million over the same period. Liquidation cascades like this occur when margin calls force platforms to close positions, pushing prices lower and triggering further stops.
Derivatives, macro drivers and investor caution
Many market participants dialed down risk exposure ahead of U.S. jobs data that could sway expectations for Federal Reserve policy. The Fed’s guidance — including commentary hinting at limited cuts and a trimmed timeline for rate reductions — has made investors cautious: cryptocurrencies typically rally on expectations of looser monetary policy and falter when cuts look uncertain.
The confluence of sizable ETF redemptions, leveraged liquidations and macro uncertainty has created an environment favoring sellers. Institutional flows into or out of spot ETH ETFs remain a key barometer for demand and can materially affect short-term price dynamics.
Technical picture: bearish flag and death cross
On the daily chart, Ethereum has formed a large bearish flag pattern. The setup began with a sharp sell-off on high volume that created the flagpole, followed by a consolidation phase on lighter volume forming the flag itself. This classic continuation pattern often precedes further downside once price breaks below the flag’s lower boundary.
Additionally, Ethereum confirmed a death cross in late November when the 50-day simple moving average crossed beneath the 200-day SMA. This crossover, combined with the bearish flag, raises the probability of continued weakness until a convincing market reversal emerges.
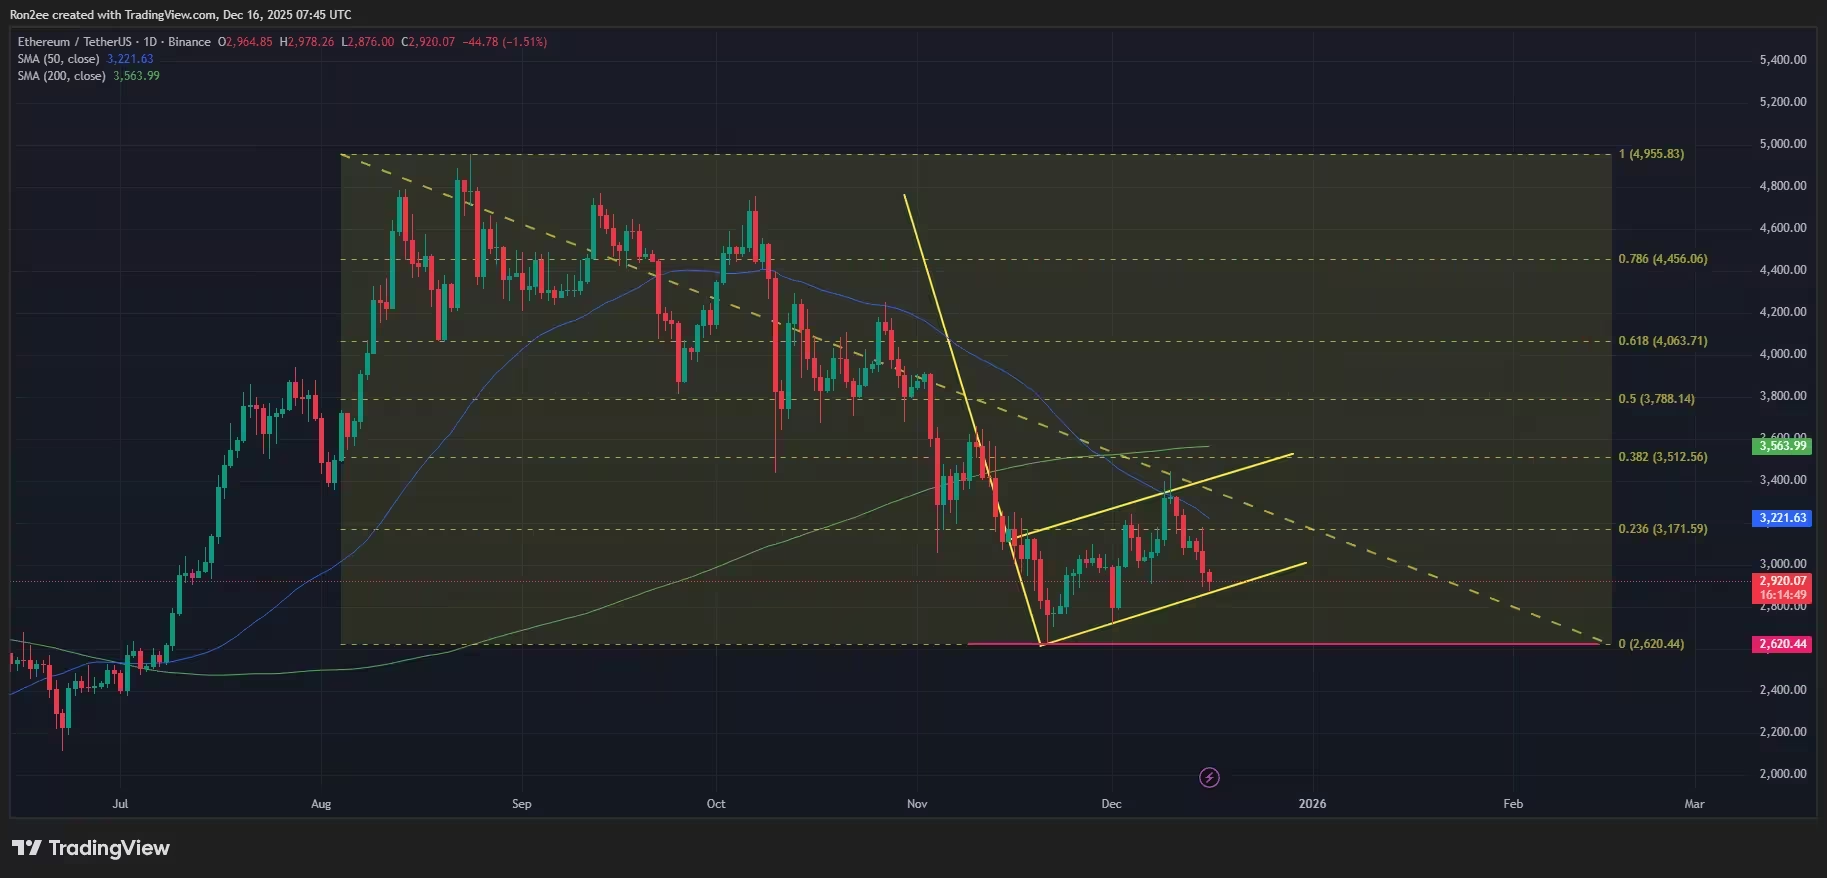
Ethereum price formed a bearish continuation pattern on the daily chart
Key levels and what traders should watch
Support and downside targets
If selling momentum resumes, ETH could target the November low near $2,620, a level that previously attracted buying and helped spark a short-term rebound. Breach of that zone would likely invite more technical selling and could extend the market’s corrective phase.
Resistance and reversal signals
On the upside, the $3,170 area aligns with the 23.6% Fibonacci retracement and represents immediate resistance. A daily close above $3,170 and a pickup in ETF inflows or easing macro risk could invalidate the near-term bearish thesis and shift momentum back toward buyers.
Outlook for investors and traders
Short term, the combination of ETF outflows, leveraged long liquidations and bearish technicals suggests a cautious approach. Traders should monitor ETF flow reports, futures funding rates and macro releases — particularly U.S. employment and Fed commentary — which can rapidly change sentiment.
Longer-term holders and institutional investors should weigh whether current weakness offers accumulation opportunities relative to fundamental adoption trends and upcoming network developments. For active traders, strict risk management is crucial: volatility remains high and stop placements should account for potential liquidation cascades.
In summary, Ethereum’s drop below $3,000 reflects a mix of flow-driven selling, derivative liquidations and macro uncertainty. Watch ETF flows and key technical levels for clues on whether ETH will stabilize or test lower supports in the weeks ahead.

Discussion
Leave a Comment