

Market snapshot: Bitcoin under pressure amid geopolitical flare-up
Bitcoin traded under renewed pressure after fresh U.S.-Iran strikes pushed risk appetite down and sent traders toward the dollar and oil. According to crypto.news market data, BTC changed hands around $62,920, remaining near the $62,000 area after a roughly 1% dip during Asian trading. Major altcoins including Ether, XRP, and Solana also showed weakness as markets reassessed macro risk.
Geopolitical shock lifts oil and dollar, dents crypto demand
The conflict between the U.S. and Iran has driven a stronger bid for crude and the greenback, with investors pricing in heightened risk around the Strait of Hormuz. Oil prices climbed and the Dollar Index held near 101, a move that historically pressures cryptocurrencies. Higher energy costs and renewed rate anxiety can force traders to reduce exposure to risk assets, which helps explain the pullback in digital-asset markets.
Spot Bitcoin ETFs provide partial support
Institutional flows into spot Bitcoin ETFs have offered limited support to BTC price action, but they have not been powerful enough to negate the wider geopolitical effect. Data from SoSoValue showed U.S. spot Bitcoin ETFs posted net inflows of $21.435 million on July 7, extending a three-session inflow streak. Earlier in the month, spot ETFs recorded sizable inflows of $221.7 million on July 2, which ended a prior 10-day outflow sequence after softer U.S. jobs data eased some rate concerns.

Bitcoin spot ETF net inflow
ETF demand can cushion declines by providing a steady source of buying, particularly when traders stay cautious. However, inflows alone have not yet driven BTC decisively above the next major resistance zone near $65,000. A sustained move above that level would signal clearer institutional conviction and open the door to a more robust bullish trend. Until then, ETF purchases can limit volatility without confirming a lasting reversal.
Technical picture: mixed signals despite short-term recovery
The BTC/USDT daily chart shows Bitcoin attempting to recover from the sharp June selloff. Price rebounded from the $58,000 to $60,000 band but remains far below the May highs around $80,000 to $82,000. The $60,000 level is a critical pivot: holding above it preserves the short-term rebound, while a break below could hand control back to sellers and trigger a fresh test of lower supports.
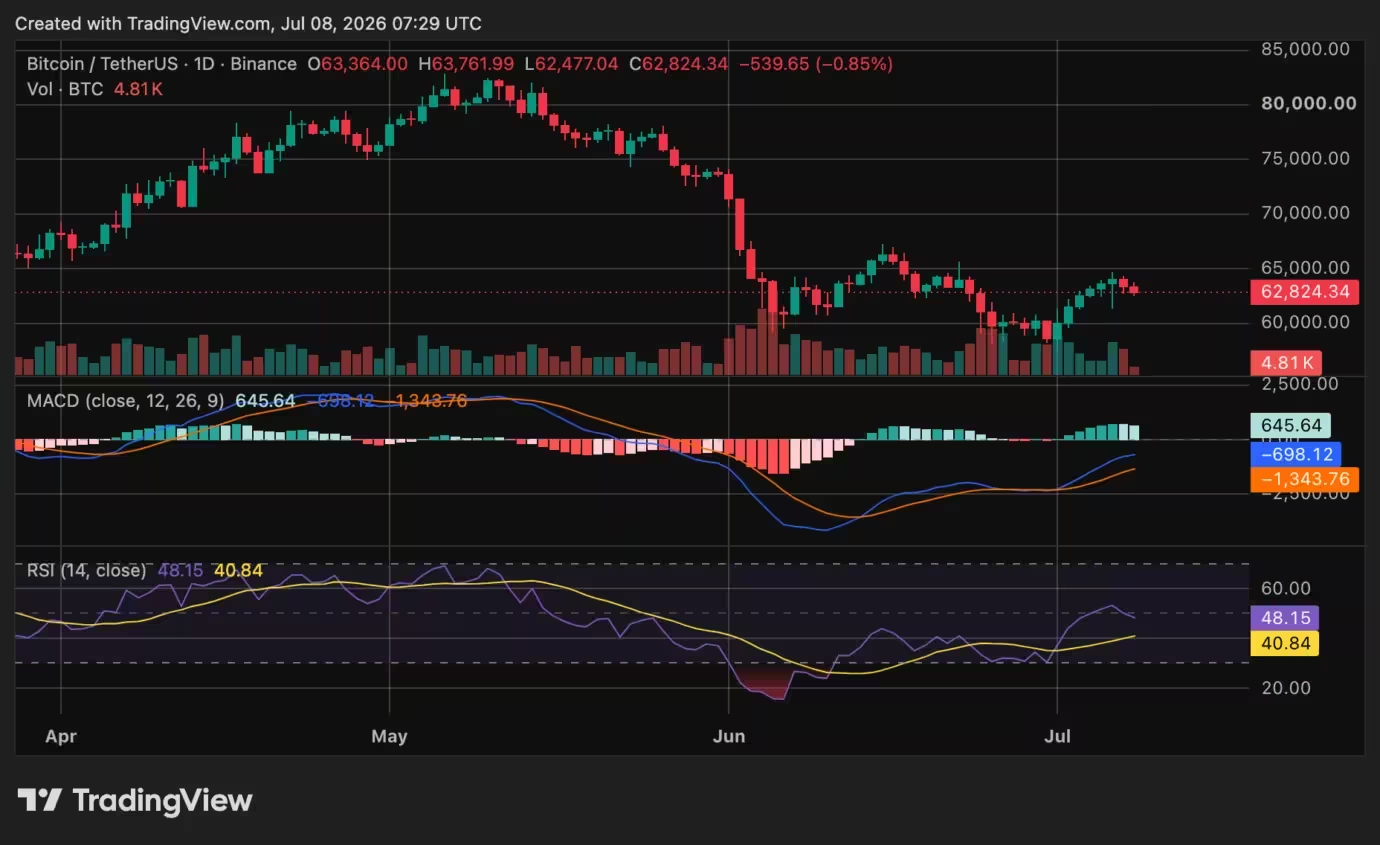

Bitcoin (BTC) price chart
Momentum indicators
Short-term momentum indicators have improved but are not yet decisively bullish. The MACD histogram has turned positive and the MACD line sits above its signal line, indicating a recovery in near-term momentum. Still, both MACD lines remain below zero, meaning the broader trend has not flipped. The RSI has edged toward 48, above its moving average but under the neutral 50 threshold. That shows buyers gained footing but have not fully seized control.
Quarterly and cycle considerations
Crypto analyst Crypto Patel noted on social media that Bitcoin printed its first bearish quarterly close since Q4 2023. Patel warned that Q3 could test the quarterly 50 EMA near $36,000; holding that area would keep the macro structure intact, but a decisive loss could invite deeper downside. These longer-term metrics underscore the split between short-term recovery attempts and persistent macro fragility.
On-chain stress signals from K33
On-chain analytics firm K33 highlighted growing stress among holders after the latest pullback. The firm found that more than 50% of circulating Bitcoin supply was sitting at a loss following the drop below $60,000. Historically, this metric has surfaced around late stages of previous bear markets, when selling pressure can diminish because many participants have already taken losses.
However, K33 cautioned that the signal does not exclude one final downside leg. Prior cycles have sometimes produced a last shakeout before a sustainable bottom formed, so investors should prepare for the possibility of another corrective move even as on-chain pain begins to ease.
What traders are watching next
Bitcoin’s near-term path remains dependent on a balance of geopolitical headlines, macro data, and institutional flows. Key levels to watch are $65,000 on the upside and $60,000 on the downside. A clean break above $65,000 would improve the outlook and suggest stronger demand, while a decisive slide below $60,000 would put bears back in control and could trigger further tests of support.
In the current environment, traders may favor dollar and oil-linked hedges during sudden macro shocks, while institutional buyers continue to use ETF vehicles to incrementally add exposure. For blockchain and crypto market participants, this means volatility will likely remain elevated and technical confirmation will be needed before a sustainable trend change is confirmed.
Bottom line

Bitcoin is navigating a delicate juncture. ETF inflows and improving short-term indicators give bulls an avenue to rebuild momentum, but escalated U.S.-Iran tensions, a firmer dollar, and weak quarterly momentum keep meaningful downside risk intact. Market participants should monitor ETF demand, MACD and RSI developments, and on-chain stress indicators like the proportion of supply held at a loss to assess whether the recent rebound can turn into a sustained recovery or whether another corrective leg awaits.

“With a background in economics and digital markets, I write about startups, finance, and the trends transforming the global economy.”

Discussion
Leave a Comment
Comments (2)
hmm, is 50% of supply at a loss really that dire? could be final shakeout or just noise, feels ambiguous rn
wow this geopolitical shock hit crypto hard… BTC clinging to 62k, ETFs buying but feels fragile, 65k is make-or-break. ugh