

Solana edges lower after fresh rejection near $107
Solana (SOL) traded down on Sept. 7 after another failed attempt to break resistance around $107. The token opened the session near $106.46, briefly tested the $106.80 area and then reversed, closing the day at approximately $104.97. That 1.4% daily pullback keeps SOL close to the psychological $105 pivot — the level that will help determine whether buyers can regroup for a retest of recent highs or whether deeper short-term support tests are coming.
Key takeaways
- SOL slipped from about $106.46 to $104.97 following resistance at $106.80–$107.50. - On the 4-hour chart SOL remains above the 20-, 50-, 100- and 200-period moving averages. - Chaikin Money Flow (CMF) has dropped into negative territory at −0.15, indicating net selling pressure in recent sessions. - Liquidation concentration sits above at ~$108 and underneath around $103, which could accelerate moves if price triggers those clusters.
Price action and consolidation after August rally
Following a sustained rally from roughly $75 in mid‑August to highs near $110 at the end of the month, SOL has entered a consolidation phase. The August advance created a pronounced gap between price and longer-term averages, reflecting strong momentum — but also leaving room for correction if short-term supports fail.
Trading volume and participation tapered during the most recent push higher, reducing the market’s ability to absorb sell-side liquidity. When participation is thin, stop runs and liquidation cascades can produce sharper intraday swings, especially in a highly leveraged crypto derivatives environment.
Where buyers and sellers are positioned
The repeated failures at the $107 area suggest persistent seller interest around the August peak. Buyers successfully defended the $98–$100 correction after the late-August pullback, but the inability to clear $107 indicates accumulation has not yet translated into sustained breakout demand.
Technical structure: moving averages and CMF
Despite the intraday weakness, Solana remains perched above multiple moving averages on the 4-hour timeframe. The 20-period simple moving average sits near $103.93, and the 50-period SMA is around $102.98 — together forming the first technical support band in the $103–$104 area. The 100-period SMA is about $101.26 and would be the next level of defense before the round-number $100 mark.


Solana price 4-hour chart — Sep. 7
The long-term 200-period moving average remains well below current prices at roughly $89.21, underscoring the scale of the August advance and preserving a bullish alignment of averages (shorter MAs above longer ones). That said, momentum indicators are showing signs of cooling. Chaikin Money Flow (CMF) has moved to −0.15, signaling that selling pressure exceeded buying pressure over the measured window. Negative CMF does not guarantee a breakdown, but it highlights that the rebound may lack robust spot-market buy-side support.
Liquidity clusters and liquidation risk
Derivative liquidation maps show concentrated leveraged positions above $108, which could act as a magnet if price reclaims $106 and breaches the $107 resistance band. A move above those levels would likely squeeze short positions and could accelerate an advance toward $109–$110.

Solana liquidation heatmap
Conversely, downside liquidity is more spread out, with notable clusters between $103–$104 and another around $102.50. A decisive break below $104 could trigger long liquidations and push SOL toward the $103–$102 zone anchored by the 20–50 period moving averages. A collapse beneath the 100-period average near $101.26 would open a cleaner path toward $100 and increase the probability of a deeper correction.
Implications of liquidation dynamics
- Upside breakout above $110 would form a higher high and validate continuation of the August rally.
- Failure to hold $103–$104 support risks feeding into short-term deleveraging and a test of the $100 psychological level.
- Traders should watch order flow and open interest for clues about which cluster is more likely to be swept next.
Daily outlook: momentum indicators and trend signals
On the daily chart Solana still trades above Supertrend support near $90.68, keeping the broader recovery intact for now. However, Aroon indicators show waning near-term momentum: Aroon Up reads 0% while Aroon Down sits around 21.43%, a configuration that points to the absence of a strong rising trend. Unless SOL can breach daily Supertrend resistance around $110.68 and close above it, the bullish case will remain tentative.
If SOL closes back below $100 on the daily timeframe, attention will shift toward $95 and the Supertrend support near $90.68 — levels that would mark a more significant test of the recovery that began in August.

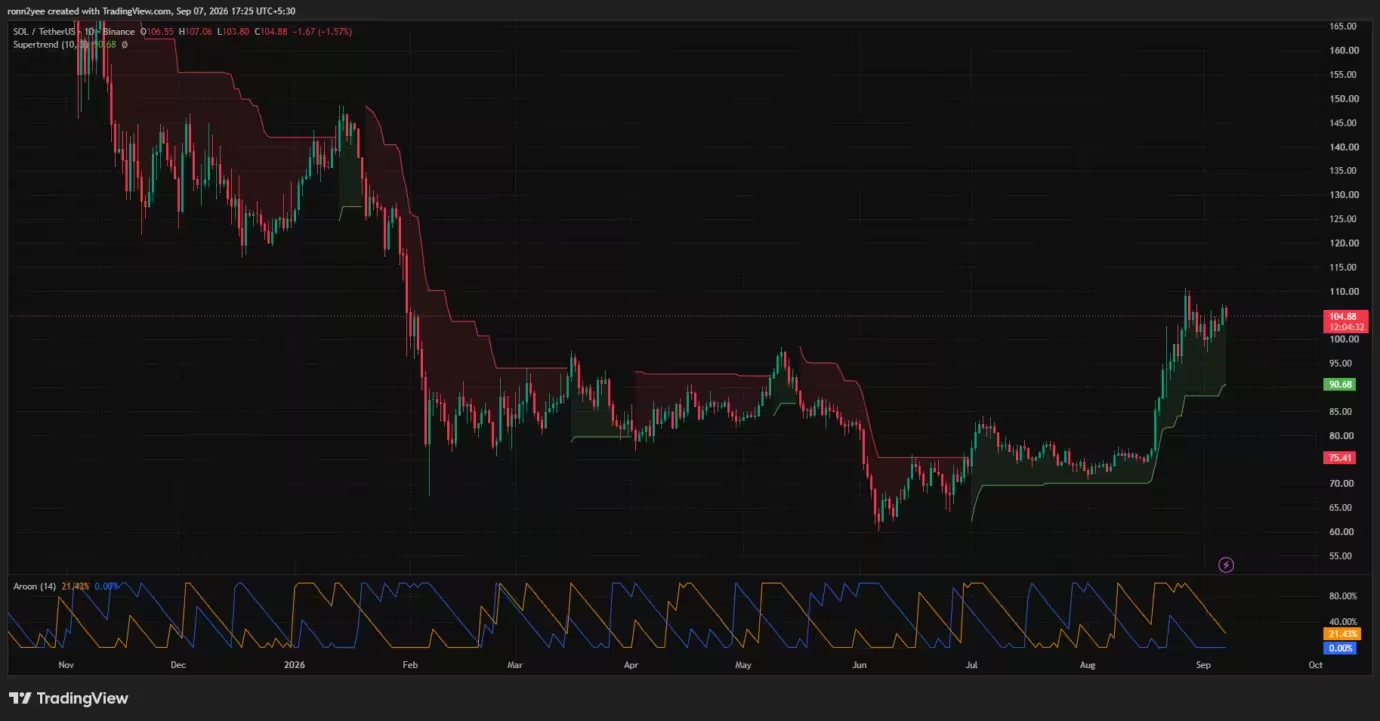
Solana price daily chart — Sep. 7
What analysts and market participants are saying
Some chart analysts expect another leg higher if the token can reestablish upward momentum. One market commentator noted that after a roughly 45% advance from an earlier buy signal near $75 to a sell signal around $109, their timing indicator may be approaching a new buy setup. These views support the possibility of renewed upside, but they rely on SOL preserving its rising structure and on improved capital flows.
Other community analyses highlighted an accumulation range in the $70–$95 zone that preceded the August expansion. While there were occasional mismatches between chart captions and posted prices in some social outputs, the broader narrative — accumulation leading into expansion — remains relevant when interpreting shorter-term pullbacks.
Macro drivers and risk factors
For U.S. traders and global macro-focused participants, Federal Reserve policy expectations remain a tail risk for high-beta crypto assets like SOL. A higher-for-longer interest-rate regime typically reduces demand for speculative assets, while any shift toward easier monetary conditions could loosen financial constraints and improve the technical backdrop for risk-on breakouts.
Other operational risks include network-specific news, broader equity market moves, and liquidity shifts in the crypto derivatives complex. Because SOL’s price action can be amplified by leverage on exchanges, monitoring funding rates, open interest and major liquidation clusters is essential for risk management.
Short-term roadmap for traders
- Immediate support: $103–$104 (20/50-period moving averages on 4H).
- Secondary technical defense: $101.26 (100-period SMA) and the $100 psychological level.
- First resistance cluster: $107–$108, with overhead liquidity up to $110.
- Watch the CMF and volume: persistent negative CMF combined with low volume raises the odds that a failure of $103 support could evolve into a larger pullback.
Conclusion
Solana’s price action after the $107 rejection reflects a market balancing between the bullish momentum that drove the August rally and emerging signs of cooling participation. Key technical levels — the $103–$104 support band and the $107–$108 resistance cluster — will likely determine whether SOL resumes an upward trajectory toward $110 or tests lower-moving averages and psychological round numbers. Traders should prioritize liquidity maps, moving-average alignment and capital-flow indicators such as CMF when sizing positions and planning entries.
Whichever side breaks first may set the path: a clean reclaim of $108–$110 could reignite the prior rally, while a decisive drop below $103 could open a corrective phase toward $100 or lower. Keep monitoring volume, open interest and macro news for conviction.


“I cover automotive innovation, electric vehicles, and the future of mobility — where technology meets sustainability.”

Discussion
Leave a Comment
Comments (3)
Pretty balanced take. August rally left big gap, 103-104 is the obvious pivot. I'd watch open interest + funding before buying
Is CMF at -0.15 really telling the whole story? Looks like thin volume could fake moves, curious if funds step in or not
Whoa, another fail at 107... feels like shorts getting comfy. If 103 breaks, watch out for a fast drop to 100. volume's weak tho