

Bitcoin surges past $76,000 amid surging ETF demand
Bitcoin extended a rapid rebound on Aug. 21, breaking above $76,000 for the first time since late May as a combination of strong spot ETF inflows, short-covering and an improved U.S. liquidity outlook powered the move. BTC rose roughly 9% in 24 hours and nearly 19% over the previous seven days, a jump that added more than $11,000 to the price in about two days.
Key takeaways
- Bitcoin reclaimed $75,000 after a brisk ~18% advance in a short period.
- U.S. spot Bitcoin ETFs recorded about $606 million in net inflows on Aug. 20, following $517 million on Aug. 19.
- Market momentum indicators turned decidedly bullish: the daily Awesome Oscillator moved into positive territory and the Chande Momentum Oscillator spiked to around 91.13.
- The U.S. Treasury will at least double long-dated bond buybacks to $4 billion per operation starting Sept. 9, which eased yields and the U.S. dollar.
- The $70,000–$72,000 range now acts as the primary support zone; a failure to hold it could invite deeper retracement.
How the rally unfolded
The rally accelerated after Bitcoin rebounded from the $62,000–$63,000 area and cleared resistance near $65,000. Once BTC penetrated $70,000 and briefly consolidated around $72,000, momentum intensified and the price pushed through $75,000.
The sharp intraday move forced many leveraged short positions to unwind: analysts cited CoinGlass figures showing almost $3 billion of liquidations as BTC crossed the $70,000 threshold, with short positions accounting for the bulk of those forced exits. Short covering helped amplify buying pressure, but it alone does not explain sustained demand.
ETF inflows point to institutional participation
U.S. spot Bitcoin exchange-traded funds recorded approximately $606 million in net inflows on Aug. 20, according to SoSoValue data, following roughly $517 million on Aug. 19. Together, those two sessions produced more than $1.1 billion in combined net buying, a clear sign that institutional capital helped drive the breakout rather than leaving it solely to derivatives-driven short squeezes.
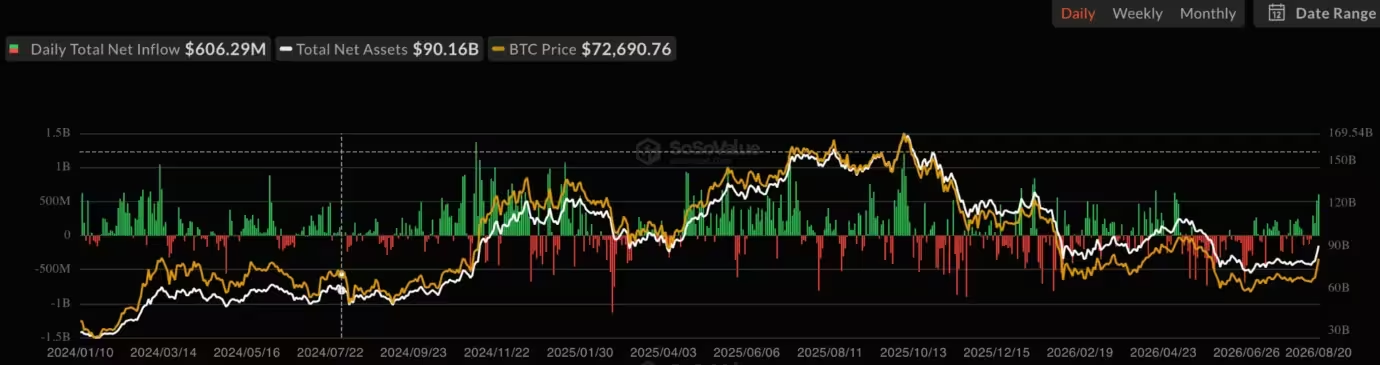
Bitcoin spot ETF net inflow
Spot Ether funds also saw meaningful flows, with about $221 million on Aug. 20, while XRP and Solana products generated roughly $13 million and $15 million respectively. Analysts emphasize that continued ETF and spot demand will be crucial if Bitcoin is to build lasting support above $70,000. Short covering offers temporary lift while spot inflows indicate more durable allocation by institutions.
Why the next ETF flow reports matter
Traders and portfolio managers will closely watch upcoming daily ETF flow reports. A continuation of sizable inflows into next week would strengthen the narrative that institutional investors are adding exposure following the breakout. Conversely, a rapid decline in flows would leave the rally more dependent on momentum trading and risk a renewed pullback.

U.S. Treasury action eases liquidity concerns
On Aug. 19 the U.S. Treasury announced it would at least double the maximum size of liquidity-support buybacks for longer-dated government securities, raising the cap from $2 billion to at least $4 billion per operation. The program begins Sept. 9 and runs through Nov. 4.
The announcement pushed long-term Treasury yields lower and weakened the U.S. dollar, improving the macro backdrop for risk assets including cryptocurrencies. While Treasury buybacks are designed to improve liquidity in the long-term government bond market and are not a direct stimulus for Bitcoin, lower bond yields make yield-sensitive and volatile assets relatively more attractive.
Political developments also played a role in market sentiment. At a White House event on Aug. 19, President Donald Trump urged Congress to pass a "fair version" of the Digital Asset Market Clarity Act and discussed the possibility of expanding U.S. Bitcoin holdings, though no purchase plan, funding mechanism or timeline has been announced.
Technical picture: momentum looks strong but heated
Volume supported the breakout, with trading activity near 13,610 BTC higher than multiple recent sessions. Short-term momentum readings turned firmly bullish: the Awesome Oscillator moved into positive territory near 3,448, indicating that recent momentum outpaced the prior sideways period. The Chande Momentum Oscillator climbed to approximately 91.13, a high reading that signals robust buying pressure but also suggests the market may be temporarily overheated after such a rapid advance.

Bitcoin (BTC) price chart
The earlier breakout refocused attention on the $65,000–$67,000 band as a zone for deeper retests. More immediately, the $70,000–$72,000 range now separates the breakout from a more significant pullback. Maintaining price action above that support band would preserve the current bullish structure and improve the odds of a continuation toward the next major resistance in the $80,000–$82,000 area, where previous selling emerged.
What traders should watch next
- Weekly close above $75,000: A weekly settlement above that level would offer stronger confirmation than an intraday print.
- ETF flow continuity: Continued net inflows into spot Bitcoin ETFs will be a key sign that institutional demand is underpinning the rally.
- Support tests: Failure to hold $70,000 could open the door to a deeper retracement after the recent 18% jump in two days.
- Macro data and Treasury operations: Movements in long-term yields and the dollar around the start of the Treasury buyback program may influence risk appetite across crypto markets.
Conclusion
Bitcoin's move above $76,000 is driven by a mix of technical short covering, meaningful spot ETF allocations and a friendlier liquidity backdrop from U.S. Treasury actions. While momentum indicators are bullish, elevated momentum readings and concentrated gains over a short period increase the importance of watching support levels and ETF flows. Sustained institutional demand and successful defense of the $70,000–$72,000 area will be key to validating a durable leg higher for BTC, while a failure to hold support could trigger a steeper retracement.
For traders and long-term investors alike, the coming days of ETF flow data, macro headlines and weekly price action will help determine whether this rally evolves into a structural shift in institutional allocation or remains a high-velocity, momentum-led advance.

“With a background in economics and digital markets, I write about startups, finance, and the trends transforming the global economy.”

Discussion
Leave a Comment
Comments
No comments yet. Be the first.