
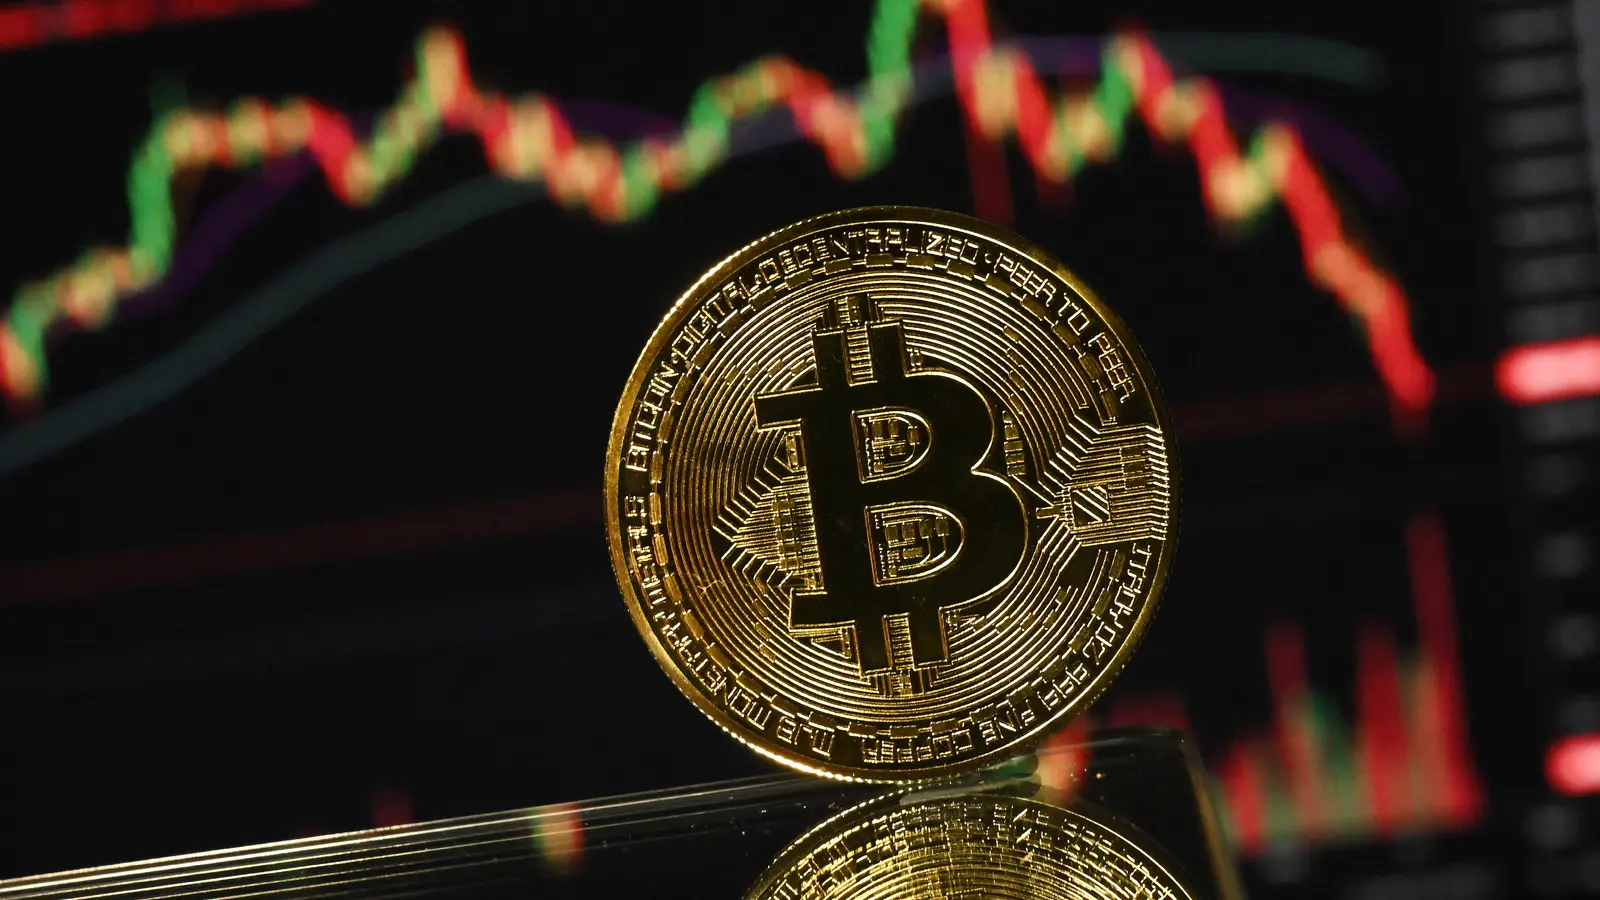
Bitcoin slips under 66K as geopolitical risks stoke oil and Fed rate fears
Bitcoin pulled back more than 1 percent on July 22 as renewed tensions between the United States and Iran pushed oil higher and nudged markets to price in a greater chance of another Federal Reserve rate hike this year. BTC traded near 65,700 after an intraday peak around 66,886, leaving the leading cryptocurrency under pressure as traders reassessed risk amid threats centered on the Strait of Hormuz.
Trump warning and regional escalation
President Donald Trump posted a warning on Truth Social saying the United States would destroy one Iranian bridge or power plant each time Iran attacks a ship transiting the waterway, adding that potential targets could include infrastructure in or near Tehran. The message increased fears of a wider confrontation that could further disrupt oil flows from the Gulf.
The post came after the collapse of interim ceasefire terms defined by the Islamabad Memorandum of Understanding, an agreement signed in June that aimed to restore commercial traffic through Hormuz and begin rolling back a US naval blockade. Iranian media and officials warned of retaliatory measures against regional infrastructure if Washington strikes bridges or power stations, and Iran's Islamic Revolutionary Guard Corps previously targeted Amazon data infrastructure in Bahrain during earlier operations, according to local reports.
Meanwhile, Iran-backed Houthi forces have threatened to block the Bab el-Mandeb Strait, forcing at least seven tankers to reroute. That compounded the risk to global energy routes, since traffic through Hormuz remains disrupted and other chokepoints now face pressure.
Oil surge revives inflation and rate hike expectations
Rising oil led traders to quickly upweight the odds of tighter policy. Brent crude climbed above 95 dollars per barrel on July 22, hitting about 95.24 at its intraday high before easing to near 94.40, a rise of more than three percent for the day. Because roughly 20 percent of global petroleum consumption moves through the Strait of Hormuz, sustained disruptions can push transport and fuel costs higher, adding to inflationary pressures for energy-dependent countries.
Those energy-driven risks influenced interest-rate expectations just days ahead of the Federal Open Market Committee meeting scheduled for July 28 29. CME FedWatch lifted the implied probability of a July hike to about 33.7 percent, up from 25.7 percent the day before. Prediction markets such as Polymarket also reflected elevated odds, pricing a roughly 65 percent chance of at least one Fed rate increase during 2026 in contracts covering the remainder of the year.

Before oil spiked, softer US inflation readings had reduced expectations for immediate tightening. A Reuters report on July 14 noted that traders had assigned only about a 10 percent chance to a July move after headline annual inflation cooled to 3.5 percent in June from 4.2 percent in May. Still, Federal Reserve minutes from the June meeting showed officials were watching energy-driven price pressures closely, with Fed staff estimating headline personal consumption expenditures inflation at 4.1 percent in May and core PCE at 3.4 percent.
Technical picture: resistance around 67,000 69,340, support near 64,500
Bitcoin has struggled to sustain a move above short-term resistance around 67,000 to 67,303 according to Supertrend levels, despite recovering from a late-June low near 58,000. On the daily timeframe the Relative Strength Index sits near 59.36, above its signal average of 53.96, indicating improving momentum without being overbought.

Bitcoin price daily chart — July 22
On the 4-hour chart BTC has traded inside an ascending channel since early July. Price tested the channel's upper boundary near 66,986 before pulling back, and the 78.6 percent Fibonacci retracement at 65,021 now serves as the first clearly visible support. A deeper retreat would bring the 61.8 percent retracement at about 63,478 into focus, followed by the channel floor close to 64,000.

Bitcoin price has been trading within an ascending channel pattern on the 4-hour chart — July 22
Momentum indicators flashed some weakness after the rejection near 67,000. The 4-hour MACD histogram moved slightly negative as the MACD line crossed below its signal line, and the ADX remained around 20.62, suggesting the current trend lacks strong directional force. A confirmed breakout above the channel top and daily Supertrend resistance would be required to shift the structure back in bulls favor, while a decisive break below 65,021 could expose lower support levels.

Order-book and on-chain dynamics further shape the path ahead. Analyst Ted Pillows identified concentrated buy orders between 64,500 and 65,500, with sell walls stacked from 67,000 to 68,000. Pillows noted that overcoming that sell-side congestion could trigger a rapid push toward 70,000. On-chain analyst Ali Charts flagged the short-term holder realized price at 69,340 as a recurring rejection zone since November, making it a crucial test for bulls if BTC clears the immediate resistance.
Bitcoin's biggest test isn't here yet
Since November every rebound has been rejected at the Short-Term Holder Realized Price. With BTC back near 66,000 all eyes are now on 69,340.
If history repeats that is where the bulls will have to prove themselves.
CoinGlass's three-day liquidation heatmap supports a similar top-heavy resistance landscape, showing the largest overhead liquidity cluster near 67,300 and dense positions around 68,000. Below the market notable liquidation pools appear near 65,000 64,400 and 63,500, leaving Bitcoin exposed to swift moves in either direction as traders react to oil prices geopolitical developments and the upcoming Fed decision.

Bitcoin liquidation heatmap
What traders should watch next
Market participants will be closely monitoring several inputs in the coming days: oil price action and shipping incident headlines that could extend energy-related inflation concerns trade and order book behavior around the 67,000 to 69,340 range short-term holder realized price levels and the Fed's commentary after the July policy meeting. A clean break above the immediate sell wall would likely accelerate bullish momentum while a coordinated unwind through the 65,000 area could provoke sharp liquidations to the downside.
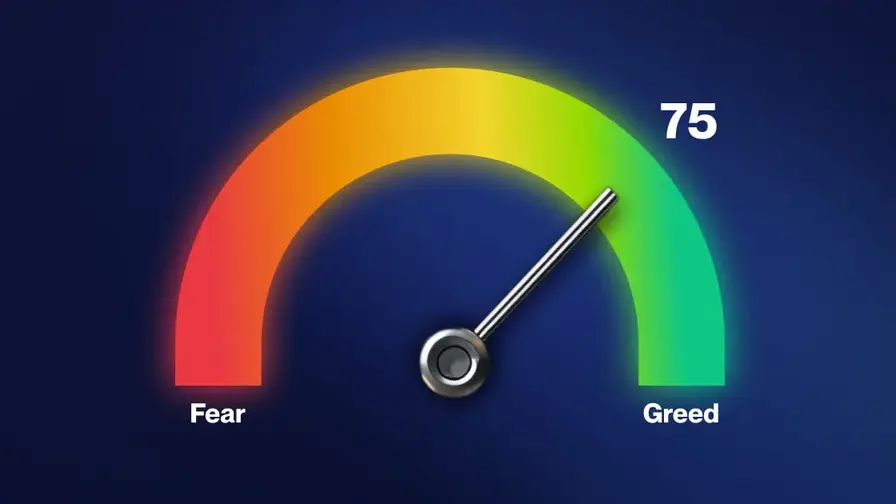
For crypto investors and traders the mix of macro energy risk on-chain resistance and liquidity clusters means volatility may remain elevated. Position sizing risk management and close attention to macro developments will be critical as Bitcoin navigates these intersecting pressures ahead of the next major macro event.

“With a background in economics and digital markets, I write about startups, finance, and the trends transforming the global economy.”

Discussion
Leave a Comment
Comments (3)
Feels overhyped but ok. BTC stuck in an ascending channel, sell walls at 67k are obvious. Manage your position size ppl, this ain’t a sprint
Is this even true? Trump threatening infrastructure, oil surges, traders pricing a Fed hike... Feels like panic-fueled trading, or am I missing something?
Wow... oil spike + Trump post? BTC back under 66k, felt that gut punch. If shipping keeps getting hit, inflation story gets real fast. buckle up