

Bitcoin is trading near $60,000 in late June 2026, roughly 52% below its all-time high near $126,000 reached late last year. The market sits in extreme fear, momentum indicators are close to oversold, and price remains below the key 50-month exponential moving average (EMA) around $65,600. That combination creates two credible narratives: one that $60K is a durable low supported by unprecedented institutional demand from spot ETFs and corporate treasuries, and another that the late-cycle correction continues toward $55K or lower, in line with historical post-halving corrections.
Key takeaways
- Bitcoin trades near $60,000, down ~18% on the month and ~52% from the peak. - Bull case: extreme fear, oversold momentum, and strong structural demand (spot ETFs, corporate treasuries) support a durable low. - Bear case: price below major moving averages, late-cycle timing ~26 months after the 2024 halving, and the risk of ETF outflows or forced selling could push BTC to $55K or lower. - The single most important technical line is the 50-month EMA (~$65,600). A monthly close above it would materially shift the outlook; failure to reclaim it keeps sellers in control. - Analyst year-end targets vary widely—from low-$40,000s to $180K–$200K and beyond—reflecting deep uncertainty.
Where Bitcoin stands right now
Bitcoin’s price action in late June 2026 is clear: a confirmed downtrend on longer timeframes and a market testing critical support. At roughly $60K, BTC is trading below the 50-month EMA (~$65,600), an indicator many long-term traders use as a dividing line between bull and bear regimes. Shorter-term moving averages—20-month EMA, 200-day MA—are also above current price, signaling significant retracement from the prior range.
Momentum metrics are weak. The monthly Relative Strength Index (RSI) sits near 31—close to the historical oversold boundary but not conclusive by itself. Across major analytics platforms, composite technical readouts skew bearish, with most tracked indicators favoring sells over buys.
Sentiment mirrors the price: the Crypto Fear and Greed Index is entrenched in extreme fear at ~18. Historically, readings this low have often coincided with bottoms, but they can also persist while price grinds lower during sustained bear markets.
The immediate support structure is well defined. Bulls are defending the ~$58,100 shelf. A decisive weekly or monthly close below that level would open $55,000 and then thinner supports beneath it. On the upside, the market must first clear the 50-month EMA near $65,600 on a monthly close to signal a meaningful regime change.

Bitcoin daily price chart
The technical picture frames the debate: oversold and fearful conditions yet below the key bull-bear line, defending a clear support level with a defined overhead resistance. Traders should treat the setup as balanced—both outcomes are plausible and driven by observable levels and flows rather than mere narratives.
You might also like: 550k BTC moves to Binance and OKX deposit addresses as Bitcoin retests $60k
The case that $60,000 is the bottom
Contrarian sentiment as a signal
The bull case begins with sentiment as a contrarian indicator. At extreme fear readings, many of the marginal sellers—those most likely to dump in panic—have already sold. When panic has exhausted itself historically, markets often find a base for recovery. The Fear and Greed Index in the high-teens is therefore a notable signal for contrarian buyers.
Oversold momentum and price structure
Momentum supports the same narrative. A monthly RSI near 31 is close to classic oversold territory; on weekly timeframes, RSI and other momentum indicators are also approaching levels that have marked prior cyclical lows. Crucially, Bitcoin is defending the $58,100 floor; as long as that level holds on clean closes, the bottoming thesis remains technically intact. That combination—sentiment exhaustion, oversold momentum, and a defended support level—forms a coherent technical base.
Institutional demand: ETFs and corporate treasuries
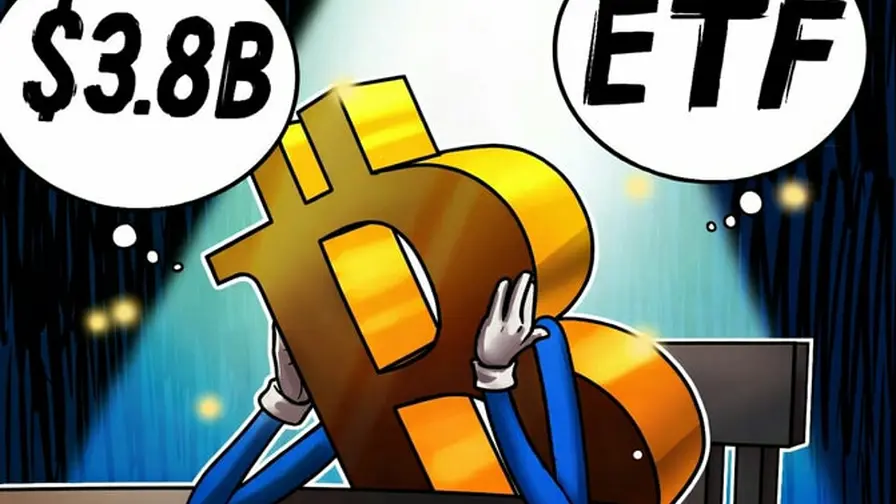
What distinguishes this cycle from earlier ones is the scale and nature of institutional demand. Spot Bitcoin ETFs now hold in excess of one million BTC across the complex. That persistent, relatively price-insensitive demand provides a structural floor that earlier cycles lacked. Corporate treasuries and large institutional wallets have also accumulated meaningful balances; while some of these holdings could be sold in stress, many are long-term allocations that reduce available float and may act as a dampener on downside moves.
Together, ETFs and treasury demand change the supply-demand equation. Bulls argue that a market with substantial institutional accumulation is less likely to see the same depth of drawdowns that characterized earlier cycles, because there is a continuous, professional bid waiting at lower prices.
Regulatory clarity and macro tailwinds
Regulatory developments in key jurisdictions—especially the U.S.—have offered clearer frameworks for Bitcoin as a digital commodity and for spot ETF operations. That clarity reduces uncertainty for institutional allocators and can encourage inflows once sentiment stabilizes. Meanwhile, a supportive macro backdrop—Fed easing or an improvement in liquidity conditions—would amplify buyers’ willingness to re-enter risk assets, helping validate a bottom around current levels.
Why $60K could look like a generational entry
If $58,100 holds and ETF inflows resume, $60K could retrospectively appear as a generational entry: an early institutional accumulation phase where long-term holders add significant positions while retail remains fearful. In that narrative, the current drawdown would be a shallow correction in a structurally stronger market.

The case that $55,000 or lower is next
Technical structure favors sellers

The bearish case is technically robust. Bitcoin trades below every major moving average that matters—from the 50-month EMA downward—and a price below declining long-term averages is the textbook definition of a downtrend. Extreme fear and oversold readings are not proof of a bottom; they are necessary conditions but not sufficient. In true bear markets, oversold indicators can remain depressed for extended stretches while prices continue to decline.
The $58,100 shelf is the hinge point. A decisive weekly or monthly close beneath it would validate the bear thesis and bring $55,000 into focus. Below $55K, support thins materially and downward momentum can accelerate, exposing round-number psychological levels and prior-cycle references.
Late-cycle timing and the halving clock
The cycle context matters. Bitcoin is roughly 26 months past the April 2024 halving, placing it deep in the late-cycle phase where, historically, prices have topped and then corrected. If the $126K peak late last year truly represented the cycle top, a 52% drawdown is within historical bear ranges and could still have farther to go. Bears argue that the historical pattern—post-halving peak followed by a substantial correction—remains the most reliable lens for the present.
Institutional structures can amplify selling
Importantly, the same institutional elements that bulls point to as a demand floor can become force multipliers for downside risk. ETFs and corporate treasuries bought at higher prices may be subject to redemptions, margin pressure, financing constraints, or balance-sheet scrutiny. If ETF flows reverse into sustained outflows, or if treasury companies face forced selling, the institutional bid can flip into a structural headwind that accelerates declines.
Why $60K might be only a pause
In this view, $60K is a way station—a pause in a larger downtrend. The late-cycle clock and a technical structure that remains clearly bearish argue for patience. Bears see $55K as the next likely shelf, with the possibility of even deeper tests depending on macro triggers like Fed tightening, dollar strength, or a broader risk-off shock.
You might also like: Why Bitcoin price can’t break above $60K despite easing tensions
The levels that will settle the debate
Rather than speculate, traders can focus on concrete levels that will tell the story. These are the objective signals the market itself provides.
Downside levels to watch

- $58,100: The immediate hinge. A weekly or monthly close below this shelf would invalidate the immediate bottom thesis and point to $55K. - $55,000: The next meaningful support shelf. Loss of this level would indicate the broader bear phase may have more room to run; below it, price support thins and downside risk increases.
The bears need that clean break below $58,100 to confirm their case. Until the market gives them that confirmation, lower targets remain hypothetical.
Upside levels to watch
- 50-month EMA (~$65,600): The single most important technical line. A monthly close above this level would shift the narrative significantly in favor of bulls. - 200-day MA (near $65,200) and 20-month EMA (near $80,000): Reclaiming these averages would signal a more durable trend change. The 20-month EMA, in particular, would confirm a transition from a relief bounce to a genuine recovery.
Bulls need a monthly close above $65,600 to claim the upper hand. A rejection there would keep sellers in charge, even if price pops higher intramonth.
The 4-year halving cycle: still relevant or changing?
No modern Bitcoin price discussion is complete without the halving cycle. The April 2024 halving reduced issuance to 3.125 BTC per block, and historically the 12–18 months following a halving have often encompassed the cycle peak and a subsequent correction. At ~26 months post-halving, Bitcoin sits where late-cycle corrections historically have been strongest.
That history supports the bearish, late-cycle view. If the $126K high was the cycle peak, the present drawdown could be part of a classic correction that historically runs deep before a durable bottom forms.
But the counterargument is consequential: institutionalization may have changed the rules. Spot ETFs, large corporate treasuries, and broad institutional adoption create a structural demand that earlier cycles lacked. This new demand can theoretically soften peaks, blunt the depth of corrections, or even extend the cycle by establishing sustained buying pressure. If that thesis proves right, the 4-year clock becomes a weaker timing tool and the current drawdown could be a mid-cycle consolidation rather than a terminal correction.
The honest position is uncertainty: nobody definitively knows whether the 4-year rhythm still governs price the way it used to, and both historical rhythm and institutional evolution are credible partial explanations.
What analysts are forecasting—and why they diverge
Analyst targets for the remainder of 2026 span an enormous range. Prominent bulls have public targets of $180K–$200K for 2026; longer-term models extend much higher (some institutional frameworks still reference Bitcoin capturing a portion of gold’s market value at $500K+). Measured institutional research groups place year-average ranges anywhere from $120K to $170K depending on macro conditions.

On the other side, algorithmic and model-driven forecasters see much lower possibilities. Some quantitative models and analyst forecasts place downside scenarios in the low-$40,000s for 2026 if macro liquidity tightens or ETF flows reverse.
This dispersion is not carelessness; it is information. The breadth of plausible outcomes reflects reliance on key variables that can push Bitcoin sharply in either direction: ETF flows (inflows vs. outflows), macro liquidity and Federal Reserve policy (easing vs. tightening), and whether the halving-driven cycle continues to dominate price mechanics. When credible forecasts span from low-$40Ks to $200K+, responsible market participants should focus on sizing risk and monitoring the objective indicators rather than adopting a single, confident number.
What would confirm a bottom, and what would break it
Real confirmation requires a cluster of aligned signals, not a single indicator.
Signs that would confirm a durable bottom
- $58,100 holds on a weekly and monthly closing basis. - Monthly close above the 50-month EMA (~$65,600), ideally accompanied by rising volume. - Consistent ETF inflows that re-establish the institutional demand floor. - A supportive macro shift: Fed easing or improved liquidity conditions that favor risk assets. - Sentiment improvement (Fear & Greed lifting from extreme fear) and a recovery in Bitcoin dominance relative to other crypto assets.
If these align, the case that $60K was the low becomes significantly stronger.
Signs that would validate further downside
- A decisive weekly or monthly close below $58,100, opening $55,000 and lower. - ETF flows turning into sustained outflows, removing the institutional bid. - Macro tightening: Fed hawkishness, stronger dollar, or a systemic risk event prompting a flight to safety. - Structural selling by leveraged corporate treasuries or large holders forced to liquidate, which could amplify declines.
Three scenarios for Bitcoin through late 2026
Below are three practical scenarios grounded in the technical and fundamental variables discussed. They are not predictions; they are structured pathways that help traders and investors prepare.
Bull scenario (upside, 2nd half recovery)

- Preconditions: $58,100 holds; ETF inflows resume; macro improves with liquidity easing; the 50-month EMA is reclaimed on a monthly close. - Path: Selling exhausts near $58K, ETFs and treasuries add on weakness, and the market reclaims $65,600. With conviction and positive flows, BTC pushes toward $80K+ by late 2026 and re-enters a more obvious bull trajectory toward six-figure prices into 2027. - Why it matters: Institutional demand changes the cycle dynamics, smoothing corrections and compressing time between major highs.
Base scenario (range-bound, volatile)
- Preconditions: $58,100 mostly holds but $65,600 remains out of reach; ETF flows oscillate with short windows of inflows and outflows. - Path: Bitcoin chops between roughly the mid-$50,000s and mid-$70,000s for the rest of 2026. Volatility remains high as participants debate the cycle’s integrity, but no clear trend emerges. - Why it matters: This scenario fits many measured analyst ranges and is consistent with a market where institutional demand exists but is not yet dominant enough to prevent prolonged uncertainty.
Bear scenario (deeper correction)
- Preconditions: A weekly or monthly close below $58,100; ETF outflows accelerate; leveraged treasuries or other forced sellers increase supply. - Path: BTC slides to $55,000 and then lower, potentially probing the low-$40,000s if macro conditions tighten or ETF outflows persist. The 4-year cycle reasserts itself and a longer accumulation phase stretches into 2027. - Why it matters: The institutional layer that supported higher valuations can also accelerate a decline if it becomes a source of liquidation rather than accumulation.
Risk management and practical guidance
For traders and investors, the objective is to use levels and flows, not opinions, to guide decisions. Treat $58,100 as the operational hinge: above it, bulls have room to argue for a recovery; below it, downside scenarios gain credibility. The 50-month EMA (~$65,600) should be monitored on monthly closes: a reclaim there materially improves the risk-reward for buyers.
Position sizing: Because analysts’ ranges are wide, adaptive position sizing is critical. Many professional allocators use a core-satellite approach: a smaller core position for long-term exposure, with tactical satellite allocations layered in around objective technical levels.
Manage liquidity and time horizon: Short-term traders should use tight risk controls and let the market confirm direction via the levels described. Long-term investors who believe in the fundamental store-of-value thesis may view current prices as opportunity to dollar-cost average while accepting the risk of further near-term volatility.
Watch flows and on-chain signals: ETF net flows, wallet and exchange flows, and on-chain metrics (e.g., realized price transitions, exchange balance changes, long-term holder behavior) provide leading information about demand dynamics and supply pressure.
Conclusion
Bitcoin’s position near $60,000 in late June 2026 is a genuine decision point. The market is balanced: extreme fear and oversold momentum could mark a durable low supported by record institutional demand, or the late-cycle technical structure could resolve lower toward $55,000 or beneath if the $58,100 shield fails. The single most informative path forward is not punditry but price and flows: reclaim the 50-month EMA on a monthly close and ETFs show sustained inflows, and bulls will have the upper hand. Lose $58,100 on a weekly or monthly close and the bears’ case strengthens.

Analysts’ targets vary widely because the outcome hinges on a few observable variables—ETF flows, macro liquidity, and the interaction of institutional demand with the halving cycle. The responsible approach is to watch the levels and the flows, size exposure to reflect uncertainty, and be ready to adapt as the market itself signals which path it has chosen.
The forecasts here are informational, not investment advice. The reality is that this moment will look, in hindsight, like either a generational buying opportunity or a bull trap. The difference will be decided by objective, monitorable signals—$58,100, $65,600, ETF flows, and macro conditions—rather than wishful thinking.

“With a background in economics and digital markets, I write about startups, finance, and the trends transforming the global economy.”

Discussion
Leave a Comment
Comments (6)
Pretty balanced take. Concrete levels help: 58,100 as hinge, 50-month EMA near 65,600 as the line. Analysts range from 40k to 200k tho, lol. Position sizing is the real alpha
Feels overhyped, 'institutional floor' sounds neat till redemptions start. too many ifs, imo. $55k could still come
I lived through the last cycle and this feels both familiar and different. ETFs holding 1m BTC is huge, but balance sheets can get ugly. Ive been DCAing since 2020, and will keep small buys around $58k, but wont FOMO high. watching closely
Is the halving rhythm still the main play? Institutional buying helps, but ETF outflows could flip the market. really unsure
Makes sense tbh. ETFs = big floor but flows can flip fast, watch $58,100.
Wow didnt expect the ETF angle to matter this much... $60k feels surreal. If $58,100 breaks, game over? Reclaim $65,600 and all bets change. nervous lol