

Bitcoin retreats after Fed signals more hikes, wiping out relief rally
Bitcoin pulled back toward the $64,000 area after a Federal Reserve outlook that surprised markets with projections for further rate hikes in 2026. The hawkish guidance erased a short-lived relief rally that had been lifted by reports of a preliminary U.S.-Iran framework and a temporary easing of Middle East tensions. Traders now face a high-stakes technical battleground, with leveraged positions concentrated near current prices increasing the risk of cascading liquidations.
Key market moves and catalyst
The market swung sharply on June 17–18: BTC climbed to an intraday high near $66,315 before reversing and sliding as low as $64,103 in early trading the following day. The U.S. central bank left the target range unchanged at 3.50%–3.75% but signaled additional tightening could come in 2026, tightening financial conditions and weighing on risk assets, including cryptocurrencies.
The prior upside move was driven in part by headlines suggesting Washington and Tehran were moving toward a framework that might reopen the Strait of Hormuz and ease energy market stress. Oil prices fell from recent highs, helping equities and crypto to rally. That bounce pushed many short positions into liquidation, with more than $150 million in bearish futures closed out as BTC briefly jumped above $66,000.
Institutional flows and demand dynamics
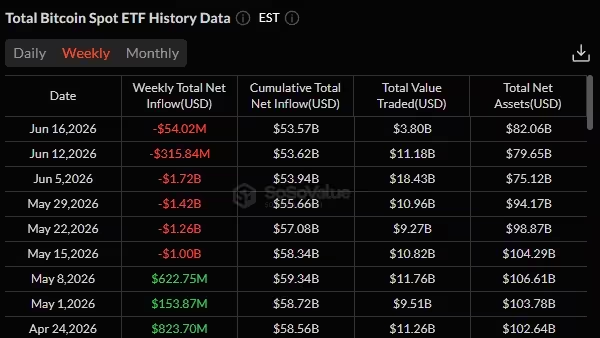
A growing concern for market participants is that spot demand remains subdued. U.S. spot Bitcoin ETFs have seen continued net outflows in recent weeks, reducing a structural bid that had supported rallies earlier in the year. Capital rotation into traditional risk assets, particularly AI-related equities and newly listed high-growth names, has also diverted speculative institutional flows away from crypto.
Technical structure: resistance, retracements, and momentum
On the daily chart, BTCs rebound stalled close to a 78.6% Fibonacci retracement around $64,230, measured from the May peak near $82,939 down to the June low at roughly $59,136. The larger 61.8% retracement sits around $68,229, highlighting the $68,000–$69,000 range as a key resistance zone if buyers regain control and push the market higher.
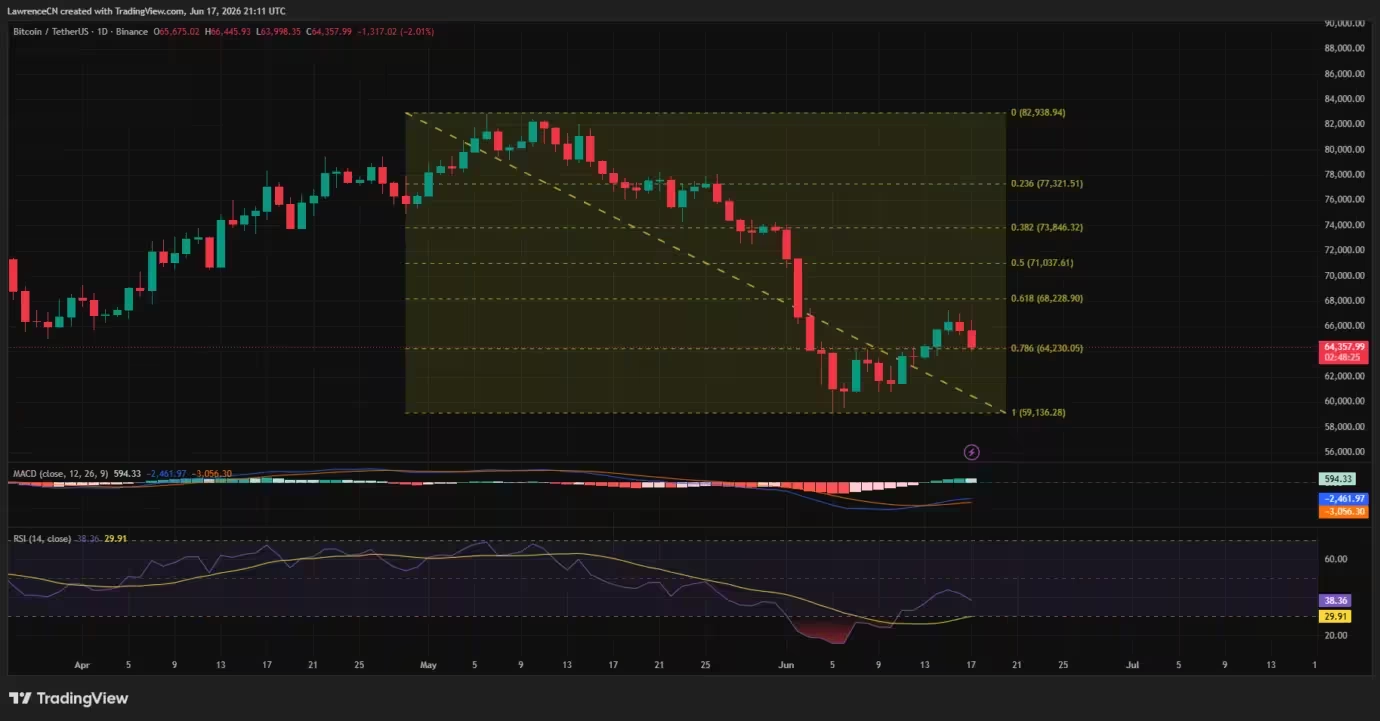
Bitcoin daily price chart — June 18
Momentum indicators are mixed. The MACD on the daily frame is recovering from deep negative readings, but the histogram remains below levels typically associated with sustainable trend reversals. The RSI is under 40, indicating bearish momentum still dominates despite last week s rebound from below $60,000.

On the shorter four-hour timeframe, BTC has pulled back to test an ascending trendline that has provided support since the June 5 low. Price remains beneath the Supertrend resistance around $67,113, a level that repeatedly capped rallies in June. The market sits just above Supertrend support near $64,500, placing current action at a technical inflection point.

Bitcoin 4-hour price chart — June 18
Indicators traders are watching
- Fibonacci retracement zones at $64k and $68k
- Daily MACD recovery vs histogram signaling limited momentum
- RSI below 40 indicating lingering bearish bias
- Supertrend lines and moving-average clusters acting as dynamic resistance
Derivatives positioning and liquidation risk
Derivatives data add another layer of short-term risk. Liquidation heatmaps from CoinGlass reveal a large concentration of leveraged long positions between $64,500 and $65,000, which had built up during the most recent rebound. BTC s slide through that area triggered a cascade of liquidations and exposed further liquidity pockets near $64,000, amplifying downside moves as margin calls and forced sells hit the order book.

Bitcoin liquidation heatmap
Analysts note the recovery looked driven more by leverage than fresh spot buying. Perpetual futures volumes climbed while spot volume lagged, suggesting the rally lacked broad-based capital inflows. As one market watcher observed, if spot volume does not pick up, the current rebound could mirror prior leveraged-driven moves that ultimately reversed sharply.
Critical support and potential downside scenarios
Many traders identify the $64,000 region as the most important short-term support level. A sustained breach under that area could clear the way toward the June lows around $60,000, where another sizable cluster of leveraged positions sits and could act as a magnet if selling accelerates.
Below current prices, liquidity concentrations around $60,000–$61,000 create a path of least resistance for bearish momentum, while failure to reclaim the Supertrend and major moving-average resistances limits bullish options. Conversely, a decisive recovery above $66,000 would likely trigger further short squeezes and refocus attention on the $68,000–$69,000 resistance corridor.
What traders and investors should watch next
- Macro cues: any shift in Fed commentary, U.S. economic data, or risk sentiment can move crypto markets quickly.
- ETF flows: sustained inflows into spot Bitcoin ETFs would strengthen the demand floor; continued outflows increase vulnerability.
- Spot vs derivatives activity: rising spot volume would confirm buyers; rising perpetual/futures activity without spot support suggests leverage-driven rallies.
- Key technical levels: $64,000 as short-term support, $60,000 as the next major buffer, and $68,000–$69,000 as major resistance if bulls recover.

In the current environment, traders should manage leverage carefully and watch liquidity zones closely. With macro conditions deteriorating relative to the earlier risk-on move and ETF flows remaining negative, Bitcoin markets remain susceptible to sharp moves driven by liquidation dynamics and shifting institutional allocations.

“I cover automotive innovation, electric vehicles, and the future of mobility — where technology meets sustainability.”

Discussion
Leave a Comment
Comments (2)
Pretty balanced take, macro + leverage explains the chop. ETF outflows are worrying. If spot doesn't show up rallies look fragile, trade small, tighten stops
Wait the Fed flags hikes in 2026 and ETFs keep bleeding... Is the bounce just leverage pump n dump? feels like a trap, hedging now