

Market snapshot: BTC slips as macro and liquidity pressures rise
Bitcoin has broken down from a bearish head-and-shoulders formation on short-term charts, putting the key $60,000 support zone under pressure and raising the probability of a deeper correction toward $57,500. Data from crypto.news shows BTC slid from an intraday peak near $64,500 to a low of $61,990 on June 23 before finding some footing around the $62,000 area.
The sell-off has been amplified by a mix of macro developments and market-specific stress: oil plunged after signs of progress in U.S.-Iran talks and a temporary 60-day waiver for Iranian crude purchases, while heavy losses in AI and semiconductor stocks dented risk appetite. Precious metals also gave back gains, with gold down roughly 1.5% and silver falling more than 5% as investors unwound safe-haven positions.
Crypto market mechanics intensified the move. Derivatives platforms recorded more than $600 million in liquidations within 24 hours, largely from leveraged long positions, and U.S. spot Bitcoin ETFs have seen sustained outflows, removing an important institutional bid that had previously helped absorb selling.
Technical evidence: H&S breakdown and downside targets
The decisive technical signal was a confirmed head-and-shoulders breakdown on the 4-hour chart after BTC fell below the neckline around $63,000. The measured-move projection from that pattern points toward roughly $57,500 as a primary downside target — approximately an 8% decline from current trading levels — and the move also snapped a rising trendline that had supported price action since early June.
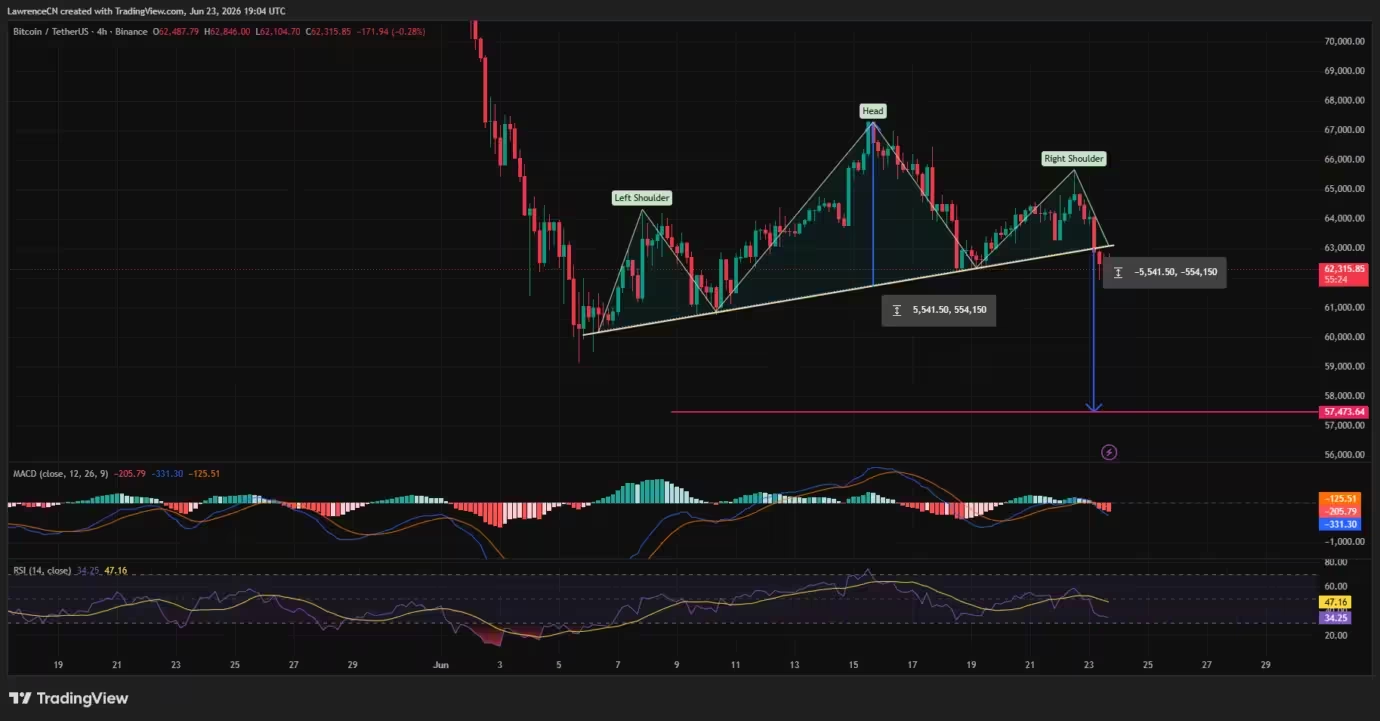
Bitcoin price has formed a bearish head-and-shoulders pattern on the 4-hour chart — June 23
Momentum indicators on intraday charts favored sellers during the decline. The MACD sits below its signal line with expanding negative divergence, while the RSI has slid toward oversold readings without a clear bullish divergence yet. On the daily timeframe, BTC remains below its Supertrend resistance near $68,400 and is trading beneath a broader rejection zone that capped buyers throughout June. Chaikin Money Flow has ticked slightly positive, indicating some capital inflows, but bulls have not reclaimed critical technical thresholds.

Bitcoin price is testing a major support level on the daily chart — June 23
Orderflow and liquidity: where stops and clusters matter

The liquidation landscape highlights how crowded some price ranges were. CoinGlass heatmaps show dense liquidation clusters in the $63,000–$65,000 band, creating a large liquidity pool above current prices that could fuel further volatility if price revisits that area. Additional concentrated positions sit around $61,500 and the $60,000 region, both of which could trigger cascading stops if breached.

Bitcoin liquidation heatmap
Analysts also flagged volume concentration: more than 1.3 million BTC traded between $60,000 and $63,000, making that band one of the market's largest historical volume clusters. That makes the $60,000–$60,600 zone especially important as immediate support. One market commentator warned that a sustained break of roughly $60,587 would widen the path to significantly lower levels, potentially exposing technical targets well into the $40,000s.
ETF flows, Coinbase premium, and institutional demand
Institutional flows have been a notable headwind. U.S. spot Bitcoin ETFs entered one of their longest outflow runs of the year, removing a steady source of buy-side demand. At the same time, a negative Coinbase premium — where U.S.-listed BTC trades below global benchmarks — signals that domestic investors have been net sellers rather than accumulators during recent sessions. Together, weak ETF flows and negative exchange premiums can magnify downside when leveraged positions unwind.
Macro drivers: geopolitics and rate expectations
Geopolitical headlines helped spark the initial risk-on move that pressured oil and, by extension, risk assets. Reports of progress in U.S.-Iran negotiations and the temporary waiver for Iranian crude pushed Brent to its lowest point in nearly three months. Yet diplomatic uncertainty persists: Tehran continues to push back on some negotiation points, and officials have warned that strategic chokepoints such as the Strait of Hormuz will not immediately revert to pre-crisis conditions.
At the same time, rising expectations that the Federal Reserve may keep policy rates elevated—or contemplate another hike later this year—are keeping many retail participants sidelined. Higher Treasury yields and broader weakness in risk assets make it harder for BTC to find buyers at current levels, increasing the chance of further downside if liquidity thins.
Key levels and scenarios to watch
- Bull case: A reclaim of the broken neckline near $63,000 would weaken the bearish thesis. If BTC pushes back above $65,000, liquidation clusters could trigger short-covering and drive a squeeze toward resistance between $66,900 and $68,400.
- Bear case: Failure to defend the $60,000–$60,600 support region would put the June low around $59,000 at risk. A decisive break below that area could lead to the head-and-shoulders target near $57,500 and potentially accelerate selling if ETF outflows and weak macro sentiment persist.
- Neutral/sideways: Bitcoin may consolidate in the mid-$60,000 to low-$60,000 band if buyers and sellers find short-term equilibrium, but volatility is likely to remain elevated while liquidation clusters and macro uncertainty sit in the background.
Trading and risk management
Traders should monitor orderflow and on-chain signals in addition to conventional technical levels. Key tools include the Coinbase premium, ETF flow data, futures funding rates, and liquidation heatmaps. Given the crowded volume clusters and the potential for quick moves, position sizing and stop management are essential. For longer-term investors, a failure to hold $60,000 does not necessarily alter longer-term adoption narratives, but it would create near-term opportunity for buyers who can withstand short-term volatility.
Conclusion

Bitcoin's recent break below the H&S neckline has increased downside risk toward the $57,500 area, driven by a mix of macro news, institutional outflows, and concentrated leveraged positions. A recovery above $63,000 would reduce immediate downside pressure, while failure to defend $60,000–$60,600 could invite deeper corrections. Market participants will be watching ETF flows, the Coinbase premium, and liquidation clusters closely as they assess the next directional move for BTC.

“With a background in economics and digital markets, I write about startups, finance, and the trends transforming the global economy.”

Discussion
Leave a Comment
Comments (3)
Solid breakdown but a tad too technical, where's the on-chain proof? liquidation clusters get mentioned a lot, tho
wow didnt expect that... 57.5k target already? felt like we just warmed up, but ok
Is this even true? ETF outflows + Iran talks.. feels like a lot of cross-market noise, or am I missing something? kinda messy