

Ethereum price hovers around $1,800 as traders wait
Ethereum (ETH) has entered a critical technical zone near $1,800 at the start of August, testing one of its key support and resistance levels. Price has been oscillating between $1,847 and $1,888 while 24-hour trading volume dropped about 15% to roughly $7.43 billion, indicating market participants are cautious and awaiting a clearer directional signal.
Key technical levels and market context
From a technical standpoint, $1,880 stands out as the most important short-term resistance. A decisive break and daily close above this level would increase the probability of a renewed bullish wave and give momentum to buyers aiming to reclaim control. Conversely, losing the $1,848 support would raise the likelihood of a slide below $1,840, with the long-term ascending trendline acting as the last major barrier against further downside.
Price structure and trendline behavior
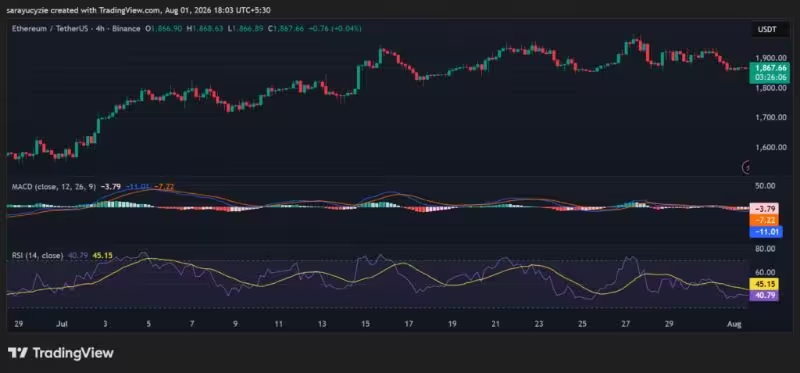
Despite recent selling pressure, ETH has retained a higher-low pattern — an encouraging sign that buyers are still attempting to reassert dominance. The long-term trendline that previously supported the uptrend has been retested, and traders will closely monitor whether it holds or breaks to identify the next market phase.
Momentum indicators: MACD and RSI
Momentum indicators remain tilted toward the bears in both short- and medium-term frames. The MACD currently sits below its signal line and in negative territory, signaling persistent bearish momentum. The Relative Strength Index (RSI) reads 40.79, showing seller advantage but stopping short of classic oversold conditions. This leaves room for either consolidation or another leg down before buyers potentially re-enter aggressively.
What traders should watch next
Market participants should watch for a clear breakout above $1,880 with rising trading volume to confirm a bullish reversal. Alternatively, a break below $1,848 and subsequent violation of the long-term trendline could open the door to deeper losses. Given subdued trading volume and mixed momentum readings, many crypto traders are likely to wait for a decisive breakout or breakdown before increasing exposure to ETH.
Overall, Ethereum remains at a pivotal juncture. On-chain fundamentals and broader blockchain market sentiment will also influence the next directional move. Traders should use risk management and monitor support/resistance, RSI, MACD, and volume for clearer signals.


“I cover automotive innovation, electric vehicles, and the future of mobility — where technology meets sustainability.”

Discussion
Leave a Comment
Comments
No comments yet. Be the first.