

Hyperliquid (HYPE) nears price discovery after sharp weekly surge
Hyperliquid (HYPE) extended a powerful rally into late August, trading near $80.50 on Aug. 25 after briefly touching a fresh all-time high around $83.27. The token’s ascent followed a rapid breakout from the $60s and pushed past previous June–July resistance near $75. Strong spot demand, reported integrations and supportive macro signals have underpinned the move — but stretched momentum and dense derivatives liquidity raise the chance of volatile swings in the short term.
Hyperliquid price reached a record high near $83.27 before easing toward $80.50.
Price action and market drivers
The week began with HYPE trading around $69.60, leaving the token with a double-digit weekly gain despite profit-taking near the peak. The rally picked up pace on Aug. 19 when HYPE vaulted from below $60 to about $70 in a single session, then continued higher as buyers absorbed supply and pushed through the mid-$70s.
The recent strength coincided with on-chain and ecosystem developments, including reported integration efforts with Coinbase and the announcement of Elysium L2 for the Hyperliquid ecosystem. Broader altcoin demand and falling long-term U.S. Treasury yields — partly driven by expanded long-dated Treasury buybacks — eased funding pressures and improved the environment for risk assets including crypto.
Key chart: daily resistance and targets
The daily chart shows HYPE trading just below the 100% Fibonacci extension level at $83.52, calculated off the move from roughly $25.64 to the current record zone. A confirmed daily close above $83.52 would push HYPE into price discovery, where historical resistance is limited and upside runs can accelerate.
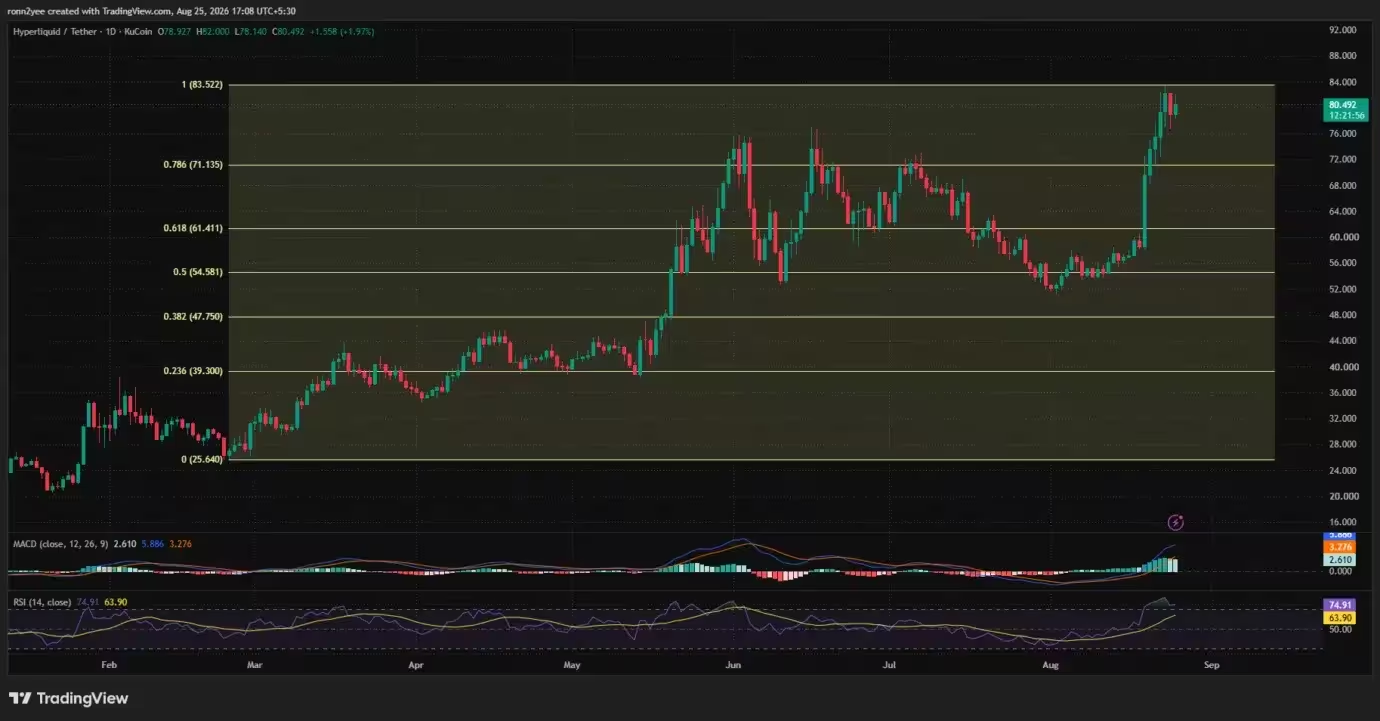
Hyperliquid price daily chart — Aug. 25
If momentum persists, psychological and technical targets come into view: $90 is the next readily identifiable milestone, followed by a $97–$100 range if momentum remains intact.
Momentum and indicator readings
Momentum indicators show the rally is stretched but still technically bullish. The daily Relative Strength Index (RSI) reached 74.91, placing HYPE in overbought territory; its RSI moving average sits lower at 63.90. While an overbought RSI does not automatically imply a reversal, it signals that the run is extended and increases the odds of temporary pullbacks or consolidation.
The moving average convergence divergence (MACD) remains positive: the MACD line stood at 5.89 above a 3.28 signal line, producing a +2.61 histogram that points to ongoing upward momentum.
Crypto analyst Havoc highlighted the token’s strong monthly performance: HYPE is printing its second-largest monthly candle at roughly +63%, second only to May’s +91% expansion. If August were to match May’s advance, the analyst suggested the token could reach about $97 by month-end — a conditional projection tied directly to continued bullish momentum.

4-hour structure and medium-term supports
On the 4-hour charts, HYPE’s bias remains bullish while above the Supertrend level at $73.05. Shorter-term indicators confirm buy-side interest, and capital-flow metrics point to real demand rather than purely leveraged speculation.
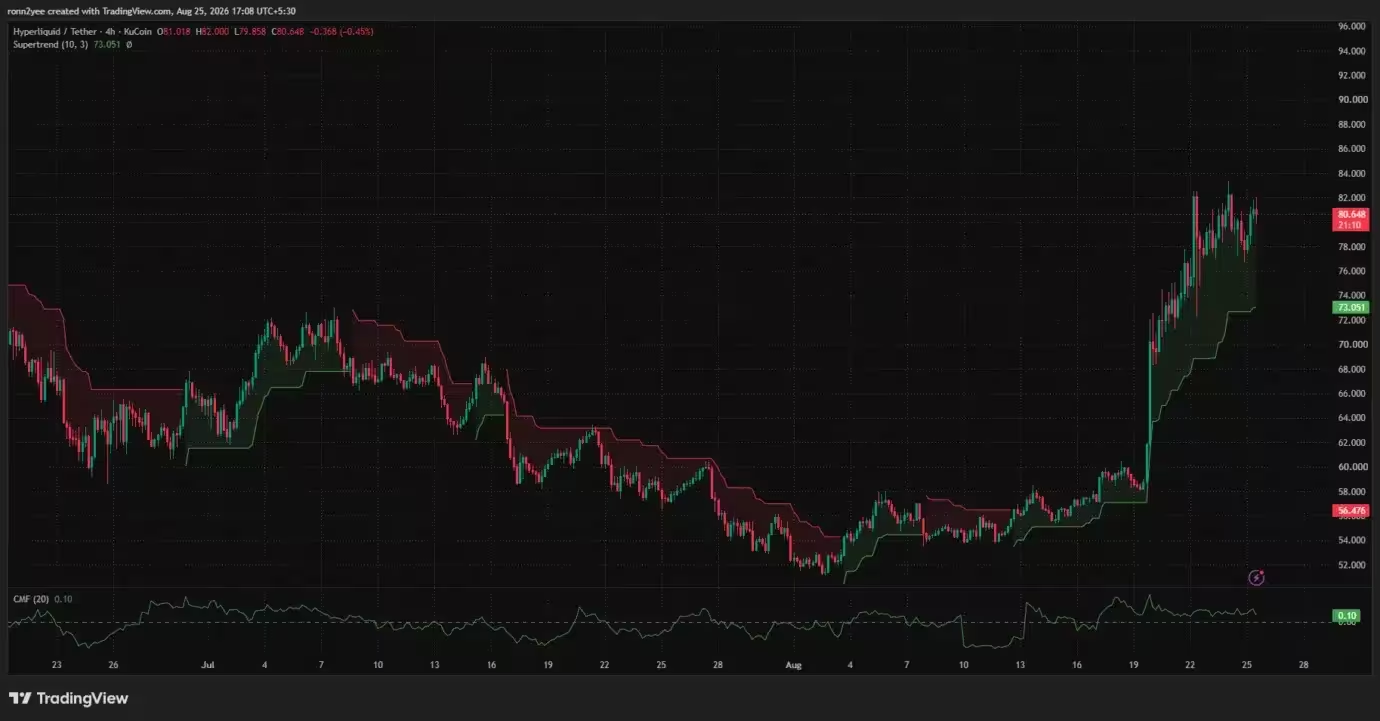
Hyperliquid price 4-hour chart — Aug. 25
Capital flows and range dynamics
The Chaikin Money Flow (CMF) registered a positive 0.10, suggesting inflows outpaced outflows during the breakout. Price has consolidated between roughly $77 and $83 after the sharp advance, a range that could allow momentum to reset without immediately invalidating the uptrend. A decisive close below $77 would, however, weaken the immediate structure and expose the Supertrend near $73.
Key support levels below the Supertrend include the prior record and Fibonacci reference around $71.14. In a deeper correction scenario, HYPE could retest the 61.8% Fibonacci retracement near $61.41, with $54.58 emerging as a major longer-term support should the uptrend break down more severely.
Derivatives heatmap: liquidation clusters and two-way risk
Leverage concentrations on both sides of the market are positioned to amplify price moves. CoinGlass’ 24-hour liquidation heatmap shows the closest upside liquidity above $82, with additional bands between about $82.50 and $84. Key overhead concentration points appear around $82.30 and $83.40.

Hyperliquid liquidation heatmap
Passing $82 could force short sellers to cover, creating aggressive market buys that may accelerate another test of the record high. On the downside, liquidity has built near $80, $79.30 and $78.40 — meaning that a slip beneath $80 could trigger leveraged long liquidations and push price down toward those clusters.
Larger liquidity pockets are visible around $76–$77, which become critical downside targets if the current consolidation breaks lower. DXT Calls & Tools described HYPE as trapped between competing liquidation magnets, although their cited deeper zones around $70–$75 and $65–$68 sit further from the immediate clusters revealed on the latest 24-hour map.
What traders and investors should watch
- Daily close above $83.52: A confirmed daily close above the 100% Fibonacci extension would favor continued price discovery and opens the path to $90 and the $97–$100 bracket.
- Failure below $77: A sustained drop under $77 would undermine the four-hour bullish structure and could extend correction toward Supertrend support near $73 and the $71.14 former resistance.
- Liquidation zones: Watch the $82–$84 range for forced short-covering and the $78–$80 area for potential long liquidations that could accelerate downside moves.
- Macro and adoption headlines: Announcements around Coinbase integration, Elysium L2 deployment, institutional flows and U.S. Treasury yield dynamics can materially influence risk appetite for altcoins like HYPE.
Risk management and outlook
HYPE’s broader bias remains bullish while price holds above $73.05 and the Supertrend. However, the combination of an overbought daily RSI and heavy derivatives positioning creates meaningful two-way risk. Traders should manage exposure with disciplined position sizing and consider using stop frameworks around the liquidity clusters described above. Long-term investors should monitor on-chain adoption, exchange flows and macro liquidity conditions as confirming signals for sustained price discovery.

In summary, Hyperliquid has entered a critical phase: a confirmed breakout above the $83.52 extension could catalyze a run toward $97, but dense leverage concentrations and stretched momentum mean volatility is likely until the market digests the recent gains.

“With a background in economics and digital markets, I write about startups, finance, and the trends transforming the global economy.”

Discussion
Leave a Comment
Comments (3)
Feels a bit overhyped, imo. Elysium L2 + Coinbase talk = hype fuel, but heavy derivatives clusters mean swings both ways. If it closes above 83.52 sure, but don't sleep on 73 Supertrend, that could hurt. position sizing pls
Price discovery at 83.52.. for real? RSI 74.9 means pullback odds high, but if Coinbase news is real then 90+ maybe? hm
wow, 63% monthly gain? insane run. But all that leverage around 82 to 84 makes me nervous, could blow up fast. tight stops imo