

NFT Market Soars to $95.48M as One Mega-Trade Skews Weekly Volume
The global NFT market registered $95.48 million in sales over the most recent seven-day period — a 170% jump compared with the prior week. That headline surge, however, was overwhelmingly driven by a single $55.03 million transaction tied to the experimental hybrid NFT project Pandora. While total dollar volume spiked, the number of transactions climbed only modestly, underscoring how concentrated high-value trades and hybrid token mechanics can distort short-term NFT market metrics.
Weekly snapshot: key metrics and what they mean
- Total NFT sales (7 days): $95.48 million, up 170% from about $35.29 million.
- Transactions: 962,992, up 7.5%.
- Buyer addresses: 172,739, up 49%.
- Seller addresses: 159,275, up 50%.
- Average value per transaction: roughly $99, compared with about $39 in the previous period.
The steep rise in dollar volume outpaced gains in buyer and seller participation, indicating that a concentrated, high-value event (Pandora) accounted for the majority of the increase. Excluding Pandora’s contribution, the rest of the market produced approximately $40.28 million in sales — a much smaller movement that better reflects broader collector and marketplace activity.
Ethereum domination — but Pandora skews the ledger
Ethereum led all blockchains with $70.81 million in reported NFT sales, or roughly 74% of total weekly volume. That figure represented an eye-catching 546% increase week-over-week, but Pandora alone accounted for about $55.21 million of that sum — nearly 78% of Ethereum’s organic NFT sales for the period.
CryptoSlam’s dashboard also flagged $592,451 in suspected wash trading on Ethereum, bringing the network’s combined reported volume to $71.40 million. When analyzing marketplace health, distinguishing organic sales from wash trading and from hybrid or tokenized positions is essential.
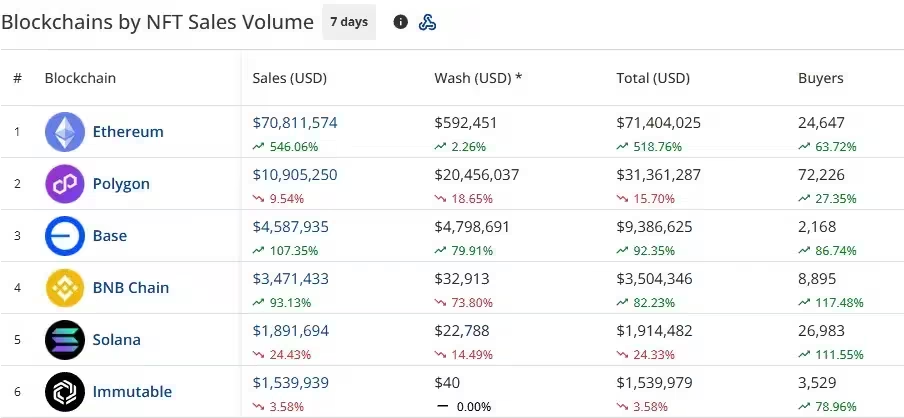
Blockchains by NFT sales volume
Polygon came in second with $10.91 million in sales, a 9.54% decline in dollar terms despite a 27% increase in buyer addresses (72,226). Polygon also reported $20.46 million in wash volume, which considerably inflates headline totals if not separated from genuine collector activity.
Base climbed 107% to $4.59 million in sales while buyer addresses jumped nearly 87% to 2,168; the network also logged about $4.80 million in wash activity. BNB Chain rose 93% to $3.47 million, with buyer wallets more than doubling to 8,895 and wash volume shrinking to $32,913. Solana’s sales slid 24% to $1.89 million, even as buyer participation surged more than 100% to 26,983 wallets.
Across the top chains — including Immutable, Blast, Panini, Flow, and Avalanche — weekly results varied widely, with some networks showing sharp percentage changes driven largely by low baseline activity and a handful of outsized trades.
Pandora collection: hybrid token mechanics and a $55M headline
Pandora dominated collection rankings, posting $55.21 million across just nine transactions. CryptoSlam’s reporting indicates three buyer wallets and seven seller wallets were involved, and the platform classified the transfers under its NFT sales totals.

Pandora led weekly NFT collection sales with $55.2 million
Pandora uses an experimental ERC-404 structure that blends fungible ERC-20–style liquidity with ERC-721 non-fungible attributes. A full PANDORA token is tied to a Replicant NFT, and transfers can mint or burn NFTs. This hybrid design creates on-chain liquidity characteristics that more closely resemble token swaps or deposit positions than conventional one-of-one NFT art sales.
Because of the collection’s linked fungible token, the economic nature of Pandora trades can be materially different from standard collectible sales. CryptoSlam lists the $55.03 million transfer as an NFT sale in its dashboard snapshot, but the platform’s data alone do not reveal whether the transaction functioned as a tokenized liquidity event, an art-market sale, or a combination of both.
Top collections and the composition of weekly volume
- Pandora: $55.21M (9 transactions)
- Courtyard (Polygon): $10.02M, down nearly 10% — 227,118 transactions, 22,725 buyers
- Beezie (Base): $2.82M, up 168% — 23,864 transactions (CryptoSlam shows 10 buyers and 224 sellers)
- CryptoPunks (Ethereum): $1.92M, up 71.5% — 20 transactions
- Bored Ape Yacht Club (Ethereum): $1.27M, up 59% — 76 transactions
- Other visible top-10: an unnamed Ethereum contract ($1.02M), Moolah DAO NFT ($986K), Guild of Guardians Heroes ($867.7K), Pudgy Penguins ($866.6K), TokenA ($689K).
Several high-value single sales on other chains also showed up in the snapshot, but none matched Pandora’s record. Examples included a Cardano NFT at roughly $73,816, GladiatorDex on BNB Chain at $30,400, and a tokenized gUSDC Locked Deposit on Arbitrum at $26,306 — an item signaling tokenized finance rather than a traditional collectible.

Why single transactions and wash trading complicate NFT market signals
This week’s data illustrate two common pitfalls when interpreting NFT market health:
- Outlier transactions can dramatically inflate reported volume. A single multi-million-dollar trade will raise weekly totals even if broader collector demand is flat. Analysts should review median values, unique buyer counts, and exclude known hybrid/tokenized transfers to understand genuine market shifts.
- Wash trading and related activity can exaggerate liquidity and revenue numbers. CryptoSlam provides wash-volume flags for multiple chains; those figures must be excluded or analyzed separately to prevent misleading conclusions about organic sales.
Investors and collectors evaluating NFT markets should therefore focus on a basket of indicators: unique buyer growth, transaction counts, floor-price trends, distribution of sale prices (median and mean), on-chain wash-trade signals, and smart contract mechanics (e.g., ERC-404 hybrids) that might reclassify a transfer as tokenized liquidity rather than pure collectible demand.
Short-term price moves in crypto and NFT demand
The surge coincided with a broader crypto market rebound: Bitcoin climbed above $72,000 during a major short squeeze while Ethereum traded north of $2,400 as ETF inflows returned. However, CryptoSlam’s data do not establish causation between rising crypto prices and the NFT uptick. The Pandora trade, in particular, makes the weekly comparison less useful as evidence of an across-the-board increase in collectible demand.
Reading the market: practical takeaways for collectors and traders
- Look beyond headline volume. Exclude outliers and hybrid-token transfers when assessing demand.
- Track unique buyer and seller growth to confirm genuine adoption.
- Monitor wash-trading flags from analytics platforms to adjust totals for organic activity.
- Analyze contract standards and token mechanics (ERC-404, tokenized deposits) before treating every NFT transfer as an art or collectible sale.
- Combine on-chain analytics with marketplace floor-price movements and community indicators (Twitter, Discord) for a fuller picture.
Outlook
This week’s numbers highlight how a single, high-value transaction or a new token model can reshape short-term market statistics. While growing buyer and seller counts are encouraging, the underlying composition of volume — whether art, sports collectibles, gaming items, or tokenized financial positions — matters greatly for long-term market narratives.
For analysts, collectors, and institutional observers, the current environment underscores the importance of granular on-chain analysis, contract-level scrutiny, and separating organic trading from liquidity-driven, hybrid token events. As NFT infrastructure continues to evolve, so will the types of assets captured by sales dashboards. That evolution will require clearer labeling, transparent classifications, and caution when using weekly volume alone to infer market strength.
If you follow NFT markets, prioritize quality signals over raw totals: unique wallets, median prices, floor movements, and wash-trade-adjusted volumes will give a more reliable view of demand than headline dollar figures alone.

“I cover automotive innovation, electric vehicles, and the future of mobility — where technology meets sustainability.”

Discussion
Leave a Comment
Comments
No comments yet. Be the first.