
Market snapshot: Solana price keeps upside momentum
Solana (SOL) continued to defend its breakout in late August, trading around $106 after a run-up that briefly pushed the token to $110. Strong US spot Solana ETF inflows and busy on-chain activity helped absorb macro pressure from slightly hotter US inflation data, keeping the short-term bullish bias intact.
Price action and intraday moves
SOL climbed from an Aug. 26 open near $96.60 to an intraday high of $110 before giving back a portion of the gains. The token slipped as low as $95.23 earlier in the movement but recovered quickly as buyers stepped in, leaving SOL roughly 10% higher than the Aug. 26 opening level. That rebound followed a renewed advance that began around Aug. 19, when SOL broke out of a long consolidation zone near $75–$80 and cleared key psychological and technical levels such as $88, $94 and $100.
Friday’s pullback after the $109–$110 test looked like profit-taking rather than a structural reversal, with the 4-hour chart still showing higher lows and an intact rising trendline that underpins the short-term uptrend.

Solana price 4-hour chart — Aug. 28
Momentum and short-term indicators
Intraday technicals remain biased to the upside. The 4-hour Supertrend indicator is bullish and offers dynamic support near $100.95; a decisive break under that level and the ascending trendline would mark the first warning sign that the near-term structure is weakening. The Awesome Oscillator sits at 8.82, comfortably above the neutral line, signaling that recent upward momentum has outpaced previous downswings — though the latest red bar suggests momentum is cooling.
ETF demand and macro backdrop
One of the strongest tailwinds for SOL has been the steady inflows into US spot Solana ETFs. Through Aug. 24, spot Solana funds posted a multi-session inflow streak that industry trackers estimated at roughly $1.22 billion, with later tallies near $1.26 billion. On several days these funds recorded their largest single-day subscriptions of 2026, helping provide regulated, US-based exposure to SOL without the need for direct custody.

It’s important to distinguish net subscriptions from trading volume: for example, Bitwise’s BSOL fund recorded a $126 million single-day trading volume figure that reflects turnover rather than fresh capital entering the product. When ETF issuers buy the underlying SOL to create new shares, however, that process can tighten spot-market liquidity and support price discovery.
Inflation data and risk sentiment
Solana’s rebound happened against a slightly more challenging macro backdrop. The Bureau of Economic Analysis reported headline Personal Consumption Expenditures (PCE) inflation at 3.7% year-over-year in July — a touch hotter than the 3.6% expected — while core PCE matched forecasts at 3.3% annual and 0.2% monthly. Initially, hotter headline inflation pushed US Treasury yields and the dollar higher, tightening conditions for risk assets. SOL briefly fell to $95.23 after the release but quickly recovered as ETF demand offset the initial de-risking move.
On-chain activity: a structural support for SOL
Network metrics provided a second pillar of support for the rally. Solana registered exceptionally high transaction throughput in August, with over 1.01 billion transactions processed during a single week — a milestone highlighting heavy chain usage, even if automated activity inflates raw counts. Tokenized-equity volume on Solana also surged: during a mid-June week, Solana handled roughly $1.298 billion of the $1.324 billion global on-chain equity volume, representing about 95% of that specific market segment.
First-half volumes for tokenized stocks reached a reported $4.9 billion, a notable increase compared with the latter half of 2025. While on-chain volume alone doesn’t guarantee sustained price gains, rising application activity and growing tokenized-equity throughput strengthen Solana’s narrative as an efficient, low-cost blockchain for financialized assets.
Supply dynamics and protocol proposals
Supply-side developments have also drawn investor attention. Solana validators and stakeholders are evaluating the Double Disinflation proposal, which would accelerate the pace at which SOL’s inflation rate declines — effectively speeding the move toward a terminal inflation rate of 1.5%. Proponents argue the change could shift the timeline from 2032 to about the first half of 2029, reducing long-term issuance and potentially improving the token’s scarcity profile. Any concrete market impact hinges on the proposal’s approval and subsequent implementation.
Technical levels to watch
On the daily chart, SOL is trading just above the 50% Fibonacci retracement at $104.41. Holding this level as support would validate the breakout and give buyers room to re-accumulate for another push toward overhead resistance.

Solana price daily chart — Aug. 28
Key technical observations:
- Immediate support: $104.41 (50% Fib) and the $100–$101 area (4-hour Supertrend/dynamic trendline).
- Near-term resistance: $109–$111, with $110 the psychological hurdle that has capped recent advances.
- Upside targets on a sustained breakout: $114.88 (38.2% Fib) and $127.83 if momentum extends.
The Aroon indicator signals a recent high that is much newer than the last major low (Aroon Up ~92.86%, Aroon Down ~14.29%), while Chaikin Money Flow is positive (~0.32), indicating accumulation has outweighed distribution over the measured period. The 4-hour trendline projects toward the $111–$112 zone in early September if the uptrend remains intact.
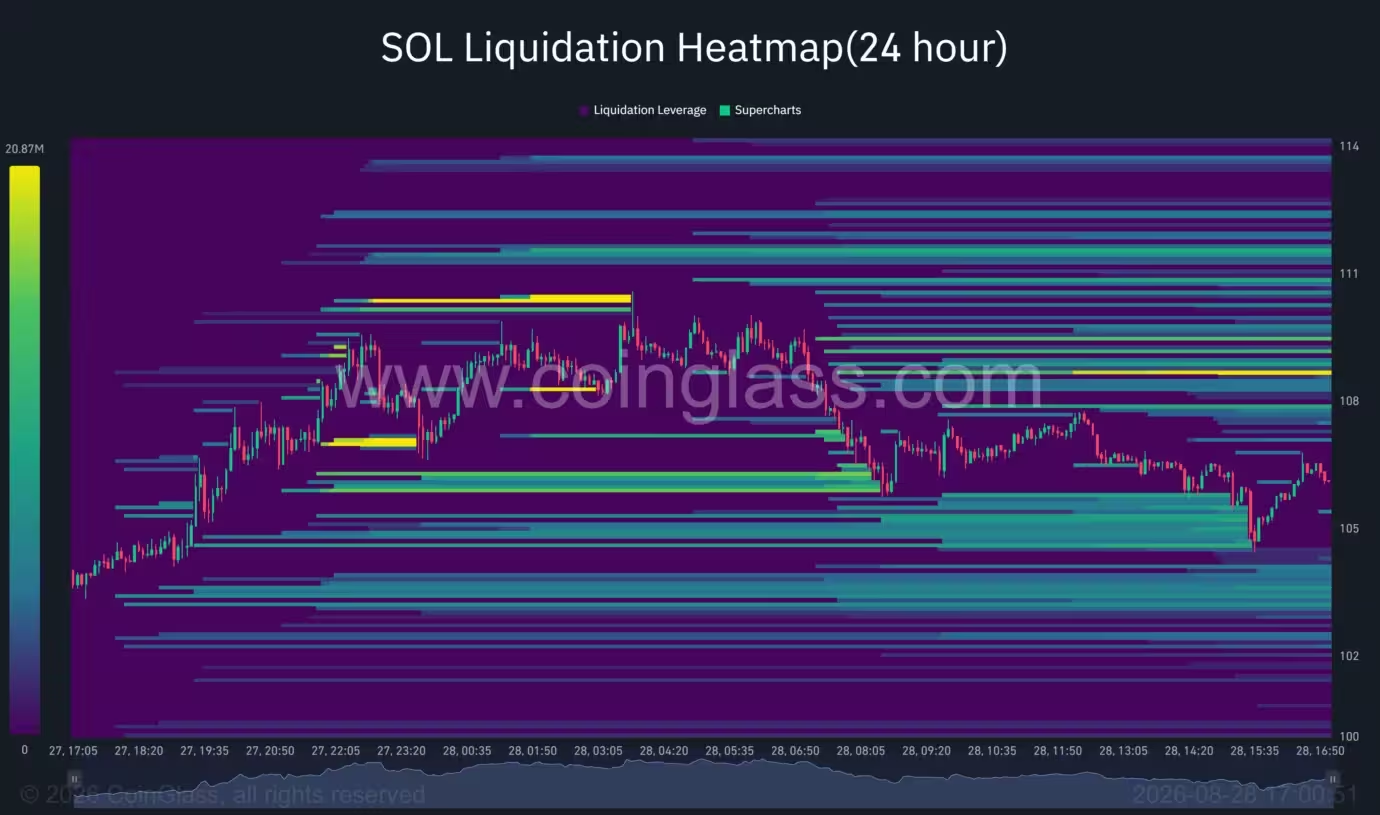
Solana liquidation heatmap
Liquidity clusters are concentrated overhead between roughly $108.50–$109 and $110.50–$111.50; breaching those bands could trigger short squeezes and add momentum to a breakout. Conversely, downside liquidity sits near $104–$105 and deeper around $102–$103. A loss of $104.41 could pull SOL toward $100.95 and potentially the 61.8% Fibonacci level near $93.95.
Scenario planning for traders and investors
Bull case: SOL maintains the rising trendline and closes daily above $110, clearing $114.88 and setting sights on $127.83. Continued ETF inflows, active on-chain markets, and approval of supply-reducing governance proposals would reinforce a sustained uptrend.
Bear case: Rejection at $110 combined with stretched daily momentum could invite a deeper correction toward $100–$104. A decisive break below the ascending trendline and Supertrend support would increase the risk of a pullback to the mid-$90s.
Bottom line

Solana’s current setup remains constructive as long as price holds the $100–$104 support band. ETF inflows and elevated network activity are meaningful catalysts that have helped SOL weather short-term macro headwinds. Traders should watch the $104.41 daily floor closely; a sustained close above $110 would open clearer paths to $114.88 and $127.83, while a failure to hold key support could prompt a corrective reset before any further leg up in this crypto market cycle.

“I cover automotive innovation, electric vehicles, and the future of mobility — where technology meets sustainability.”

Discussion
Leave a Comment
Comments (3)
Feels a bit overhyped, if it cant hold 104.4 daily, watch for a drop to mid 90s. Also curious about that Double Disinflation vote
Is the on-chain volume real users or bots? 1bn txs sounds wild but could be inflated, anyone dug deeper?
Wow didnt expect ETF flows to shove SOL past 110 so fast... nervous about the squeeze tho, but looks strong 😬