
5 Minutes
Ethereum slips toward critical support amid broad crypto sell-off
Ethereum (ETH) has edged lower to roughly $1,630 after losing about 4% in the past 24 hours, as technical signals and market-wide liquidations kept traders on alert for a further leg down. The pullback coincided with weakness in Bitcoin (BTC) and sectorwide outflows, reinforcing concerns that risk appetite has cooled across crypto markets.
Market context: BTC weakness and liquidation spikes
Data from crypto.news showed ETH trading near $1,628 on June 10, down roughly 4% over 24 hours. Bitcoin fell about 4.7% to near $61,050, dragging total crypto market capitalization down by approximately 3.5% to $2.12 trillion. Other major tokens, including XRP, also traded lower, underlining that the retracement extended beyond just BTC and ETH.
The drop coincided with heavy derivatives activity: roughly $468 million in crypto liquidations were recorded over the previous 24 hours. Bitcoin declines alone eliminated nearly $130 million of positions as prices moved sharply from the $64,100 area. A liquidation heatmap cited by market observers highlighted about $331 million in long liquidations, while short positions totaling approximately $1.84 billion remained vulnerable to a swift reversal, a setup that can amplify volatility in either direction.
ETF flows and fund movement add mixed signals
Exchange-traded fund flows offered conflicting signals: U.S. spot Bitcoin ETFs posted net outflows of about $91.37 million, while spot Ethereum ETFs attracted inflows of near $82.37 million, according to SoSoValue data. Those divergent flows reflect both rotation within crypto allocations and the persistent sensitivity of capital to short-term price moves.
Technical picture: failure to reclaim $1,700 could be pivotal
On-chain and chart-based analysts pointed to a key resistance zone around $1,700. After acting as a bottom in February 2026, that region has been defended by sellers and now appears to be a choke point for any sustained ETH recovery. Analyst Ted Pillows warned that if Ethereum cannot reclaim $1,700, it could sweep lower to the next support band near $1,540.
Additional technical indicators reinforce the cautious bias. On the daily timeframe, ETH still trades below the Supertrend resistance, located near $1,850 — a level many traders watch for signs of trend reversal. Short-term oscillators, like the Stochastic RSI, have recovered from oversold readings, which may allow for a short-lived relief bounce, but they have not confirmed a durable trend change.
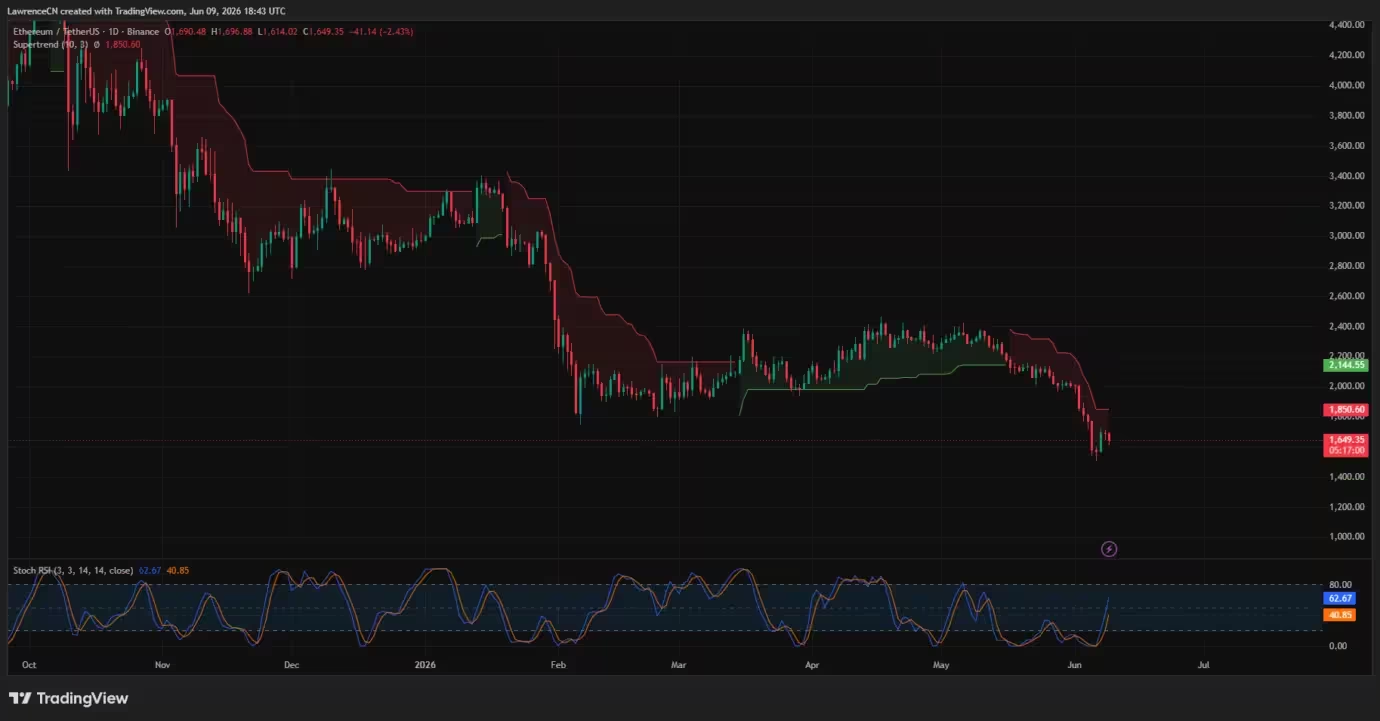
Ethereum daily price chart — June 10
Weekly supports and downside targets
On longer timeframes, weekly price action shows ETH testing a pivotal base near $1,530, a level that previously absorbed major pullbacks in 2023 and 2025. Momentum on the weekly chart remains weak: the MACD sits in bearish territory and the Chaikin Money Flow is around negative 0.22, signaling persistent capital outflows from the token.
According to the weekly technical setup, a decisive break under $1,530 could open the way toward much lower support near $1,064. Conversely, a sustained recovery would likely require reclaiming the $1,700 zone and pushing back above the daily Supertrend, around $1,850, to reestablish a bullish structure.

Ethereum weekly price chart with key support levels — June 10
What traders should watch next
Short-term market participants and swing traders should monitor several key levels and indicators: the $1,700 resistance band, daily Supertrend near $1,850, and weekly support around $1,530. Derivatives flows and liquidation maps remain critical to understanding potential forced moves; the current backdrop — with hundreds of millions in at-risk positions — means that even small directional shifts can trigger outsized volatility.
Macro drivers and crypto-specific headlines also matter. Security-related concerns, regulatory developments, and liquidity rotation between spot BTC and ETH ETFs could accelerate either a capitulation or a quick rebound. If Bitcoin stabilizes above $60,000, it may provide the platform ETH needs to retake $1,700. If BTC breaks lower, the path toward $1,540 and beyond becomes much more likely.
Risk management and strategy
Given the mixed technical signals and potential for sharp liquidation-driven moves, risk management is essential. Traders should consider position sizing, stop placement below key supports, and scenario planning for both a relief rally and a deeper sell-off. For investors focused on longer-term fundamentals, dips into historically significant support zones may present accumulation opportunities, but only if accompanied by improving on-chain metrics and macro stability.
In sum, Ethereum sits at a crossroads. Failure to clear and hold above $1,700 could expose the market to a deeper correction toward mid-$1,000 support levels, while reclaiming resistance zones would be the first sign of a recovery cycle resuming.
Source: crypto


Comments
Armin
Hmm, tense. If BTC doesn't hold 60k, ETH prob heads to ~1.5k. Holding a little, but nervous af, stoplosses ready lol
blocktone
Is this even true? ETH slipping below 1,700 again feels kinda scripted, liquidation maps look scary but who's really pulling strings here, funds or algos? if that's real then...

Leave a Comment