
6 Minutes
Ethereum edges toward $1,700 as sellers stay in control
Ethereum (ETH) traded near $1,691 at the time of reporting, recovering modestly after a sharp pullback that nearly reached $1,500 last week. Despite the uplift, technical momentum indicators and on-chain metrics suggest the market remains fragile. The path forward largely depends on whether buyers can reclaim the $1,700–$1,715 band and push toward the more significant $1,900–$2,000 resistance region, or if sellers succeed in dragging prices back to test $1,500 and potentially lower support.
Short-term price range and critical levels
The intraday range recently saw ETH move between roughly $1,656 and $1,713. Immediate support is clustering at $1,650, with nearby floors at $1,580 and $1,540 and a more consequential level at the June low near $1,505. For bulls to assert control, ETH needs a daily close above $1,715 to attempt a run at $1,875 and ultimately challenge the broader $1,900–$2,000 zone. Conversely, a weekly close below $1,500 would increase the probability of a deeper correction toward the $1,000–$1,100 area.
Volume and market participation
Trading volume during the decline remained elevated, with roughly 100,260 ETH exchanged during the observed period, indicating strong participation on the sell-off. Elevated volume during drops often signals conviction among sellers, and until a convincing shift in volume favors the upside, corrective rallies may remain temporary.
Technical indicators: MACD and Aroon still point bearish
Ethereum's MACD remains under its signal line, showing that downside momentum has not fully abated. The MACD histogram is negative and not yet contracting in a way that would signal a clear momentum reversal. Traders typically look for the MACD line to move higher and cross above the signal line as an early confirmation that selling pressure is weakening.
The Aroon Oscillator reading is strongly negative, reflecting that recent lows are outpacing recent highs. This continuation of lower-highs and lower-lows supports the view that sellers still dominate broader price structure despite short-term bounces. Neither indicator provides a precise market bottom — relief rallies from oversold conditions are possible — but sustained trend change requires higher lows and staunch resistance breaks.

Ethereum (ETH) price chart
On-chain context and profitability
On-chain metrics show strained profitability for holders. Only a small portion of circulating ETH currently sits with threefold unrealized gains, the lowest such share since 2017. Low on-chain profitability can be a double-edged sword: it may indicate capitulation and a potential accumulation opportunity, but it also implies less price cushioning if another leg down occurs.
Staking remains a material part of Ethereum's supply dynamics. A large share of ETH is illiquid while staked, reducing immediate exchange liquidity and influencing price reactions to large buy or sell events.
BitMine accumulation: corporate demand versus weak ETF flows
BitMine Immersion Technologies was a notable buyer during the latest weakness, acquiring 126,971 ETH in the observed week. That purchase lifted BitMine's treasury to roughly 5.54 million ETH, representing an estimated 4.59% of Ethereum’s circulating supply. Valued near $9.04 billion using a reference price around $1,630, the company also reported that about 4.72 million ETH remained staked and cited projected staking revenue in the hundreds of millions annually.
BitMine's accumulation adds a layer of corporate demand that can absorb selling pressure and support prices. However, institutional and ETF flows paint a mixed picture: U.S. spot Ethereum ETFs experienced notable outflows in May and early June, although some funds recorded net inflows on certain days, lifting cumulative assets to multi-billion-dollar levels. The interplay between concentrated corporate buyers and volatile ETF flows will be a key dynamic to watch for price stability.
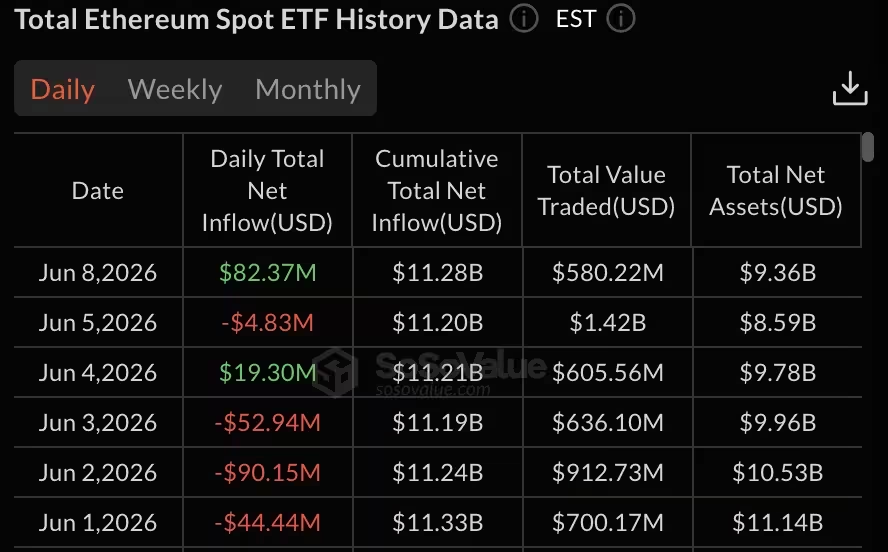
Ethereum (ETH) spot ETF data
Comparisons to past crashes and long-term perspective
Some analysts have compared this pullback to June 2022, when ETH fell to under $900 before beginning a protracted recovery. A repeat of that pattern is possible if $1,500 holds as a durable support and liquidity conditions allow buyers to accumulate. But important differences exist: macro liquidity, interest rate settings, institutional participation, and supply dynamics are not identical to 2022. The weekly 200 moving average—currently well above spot price—remains a longer-term resistance hurdle that the market would need to clear to signal a sustained recovery.
Other long-term indicators, like market-value-to-realized-value bands and TD Sequential signals, have historically highlighted attractive accumulation zones during deep drawdowns. Still, these are not guarantees; they are tools that help frame risk-reward during volatility.
What traders should watch next
Key levels to monitor:
- Immediate support: $1,650
- Short-term resistance: $1,700–$1,715
- Intermediate targets: $1,875, then $1,900–$2,000
- Risk level on weekly close: $1,500 (breach risks $1,000–$1,100)
Watch technical momentum (MACD cross and histogram contraction), Aroon readings, and volume patterns for early signs of trend change. On-chain flows, staking behavior, and ETF net flows will provide context for whether institutional demand can offset retail selling.
Conclusion: BitMine’s sizable buyback gave ETH temporary relief and underscored how corporate treasuries can influence market dynamics. Yet the broader structure remains bearish until ETH secures higher lows and overcomes the $1,700–$1,715 zone. A confirmed move above $1,900–$2,000 would meaningfully improve the outlook; failure to defend $1,500 on a weekly basis would reopen the path to substantially lower support.
Source: crypto


Leave a Comment