
5 Minutes
Bitcoin slips below $60,000 amid renewed tech-led risk-off
Bitcoin (BTC) failed to reclaim the $60,000 level on Friday as global markets turned cautious once more. The daily close beneath $60,000 marks the first sub-$60K daily settlement since September 2024, raising the prospect that former support could act as near-term resistance for BTC.
Data from market feeds showed price weakness continuing after another tech-driven sell-off in Asian equity markets, where losses accelerated and triggered circuit-breakers in South Korea. The pullback in risk assets keeps macro-driven narratives — inflation, monetary policy, and sector rotation — at the forefront for crypto investors.

BTC/USD one-hour chart.
Equities context: tech stocks lead the decline
While U.S. benchmarks avoided the worst of the rout at the time of writing, Asian markets saw deeper declines. The S&P 500 and Dow Jones were in modestly positive territory in intraday trade, but technology names continued to struggle, contributing to downward pressure on crypto as traders reassess risk exposure.
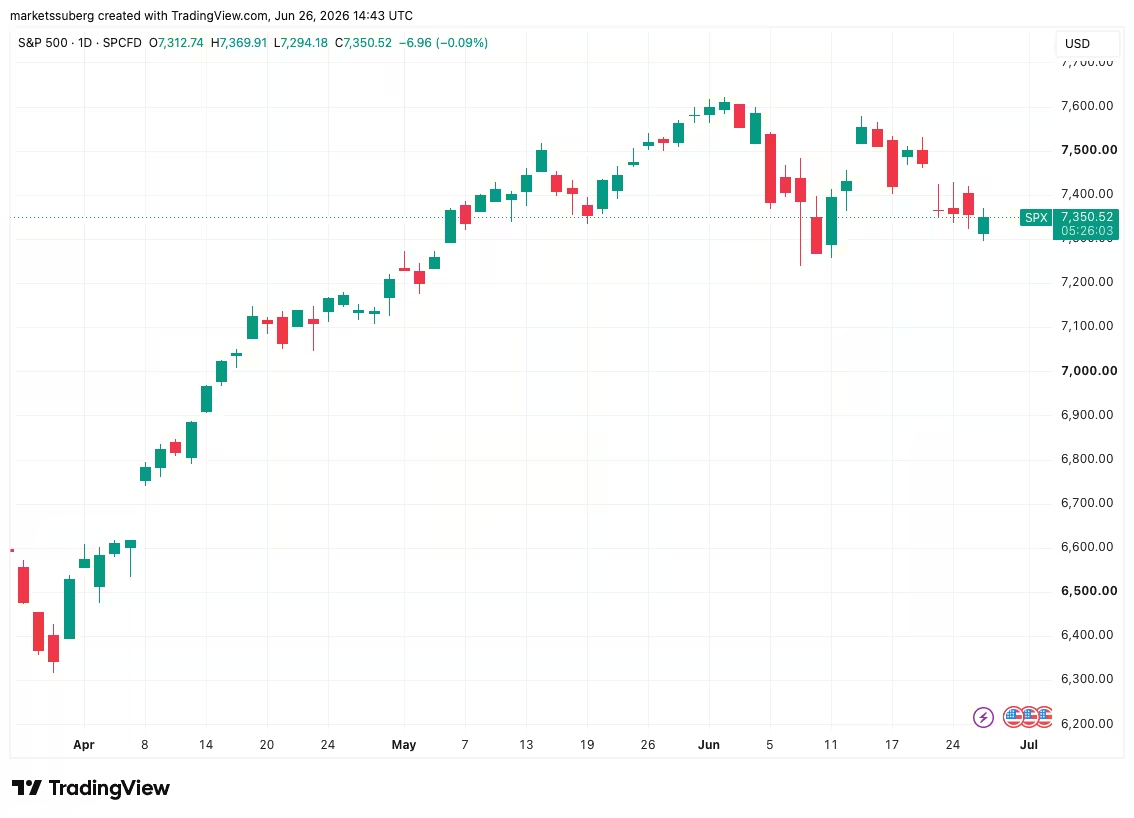
S&P 500 one-day chart.
Big tech valuations under scrutiny
Trading commentators highlighted how many major technology companies are already in pronounced bear-market territory, with several names off more than 50% from their all-time highs. Crypto-native equities also reflected the strain: Coinbase stock, for example, remains sharply lower year-over-year.

Coinbase stock one-week chart.
Market strategists such as The Kobeissi Letter argued that the market may be closer to a broader bullish reversal than sentiment suggests, but volatility and sector-specific pressure make timing uncertain. Micron impressed with better-than-expected earnings earlier in the week, yet that wasn’t enough to restore broad market confidence.
Inflation data and Fed expectations continue to shape risk assets
Macro commentary from trading desks emphasized the enduring influence of U.S. inflation readings on risk asset pricing — a key input for both equities and crypto. The Federal Reserve’s preferred inflation gauge, the Personal Consumption Expenditures (PCE) index, showed the largest year-on-year increase since mid-2023 in May, forcing markets to reassess policy outlooks.

US PCE Index one-month % change (screenshot).
QCP Capital noted nowcasts that keep core and headline PCE above the Fed’s target, and the bank’s 2026 inflation forecast has been revised higher. That backdrop reinforces the view that inflation — rather than growth — may be the primary constraint on risk appetite through the remainder of the year.
Technical picture: 200-week SMA is the key level to watch
On-chain observers and technical analysts are focused on whether BTC can bounce and close back above the 200-week simple moving average (SMA). That trend line, a long-term gauge widely followed by institutional and retail traders alike, stood around $62,243 at the time of reporting.

BTC/USD one-day chart with 200-week SMA.
Crypto strategist Michaël van de Poppe highlighted mixed signals: a short-term stall around $60,000 combined with a bullish divergence on daily indicators that remains unconfirmed. He also pointed to upcoming quarterly options expiry as a potential catalyst for directional moves in BTC.
Additionally, activity tied to large Bitcoin holders and investment vehicles is being watched closely. Stretch (STRC), a Bitcoin funding vehicle connected to a firm with one of the largest BTC treasuries, posted a notable drawdown, which traders are parsing for implications about institutional demand.
What traders should consider
- Monitor the 200-week SMA as a confirmation threshold for longer-term bulls; a decisive weekly close above it would support the recovery thesis.
- Watch U.S. inflation prints and Fed guidance — sticky inflation tends to compress risk asset multiples and can weigh on crypto momentum.
- Keep an eye on options expiry and flows from large Bitcoin holders for short-term volatility cues.
As macro and sector rotations continue to ripple across markets, Bitcoin’s path will be determined by a mix of sentiment, macro data, and technical positioning. Traders and investors should prepare for heightened volatility while tracking key levels and fundamental drivers that will guide the next leg of BTC price discovery.
Source: cointelegraph


Leave a Comment