
8 Minutes
Market snapshot: ETH drifts under short-term resistance
Ethereum was trading around $1,672 according to crypto.news market data as downward pressure persisted across spot and derivatives markets. Over the past 24 hours ETH was down about 1.16%, and it has lost roughly 6.48% over the last seven days. Daily trading volume sat near $9.23 billion while price oscillated between $1,642 and $1,692 during the same period.
Key price levels and moving averages
After failing to hold gains above the $1,750 zone, Ether remains below its 200-hour simple moving average (SMA), a short-term benchmark traders watch to gauge the momentum. That area — followed closely by $1,800 on the upside — is now the immediate test for bullish conviction. On the downside, $1,580 is emerging as a near-term target if sellers regain control.
Technical outlook: indicators point to fragile recovery
Technical indicators show tentative stabilization but not a confirmed trend reversal. The MACD histogram registered a positive reading near 13.58, while the MACD line sat around -64.53 above a signal line near -78.11. That configuration signals some short-term bullish momentum after recent selling, but both MACD lines remain under zero, meaning the broader trend is still biased downward.
The RSI hovered near 37.81, slightly below its moving average at 38.56 and well under the neutral 50 threshold. That indicates buying strength is limited: ETH has moved away from deeply oversold levels, yet momentum is fragile and susceptible to renewed selling.
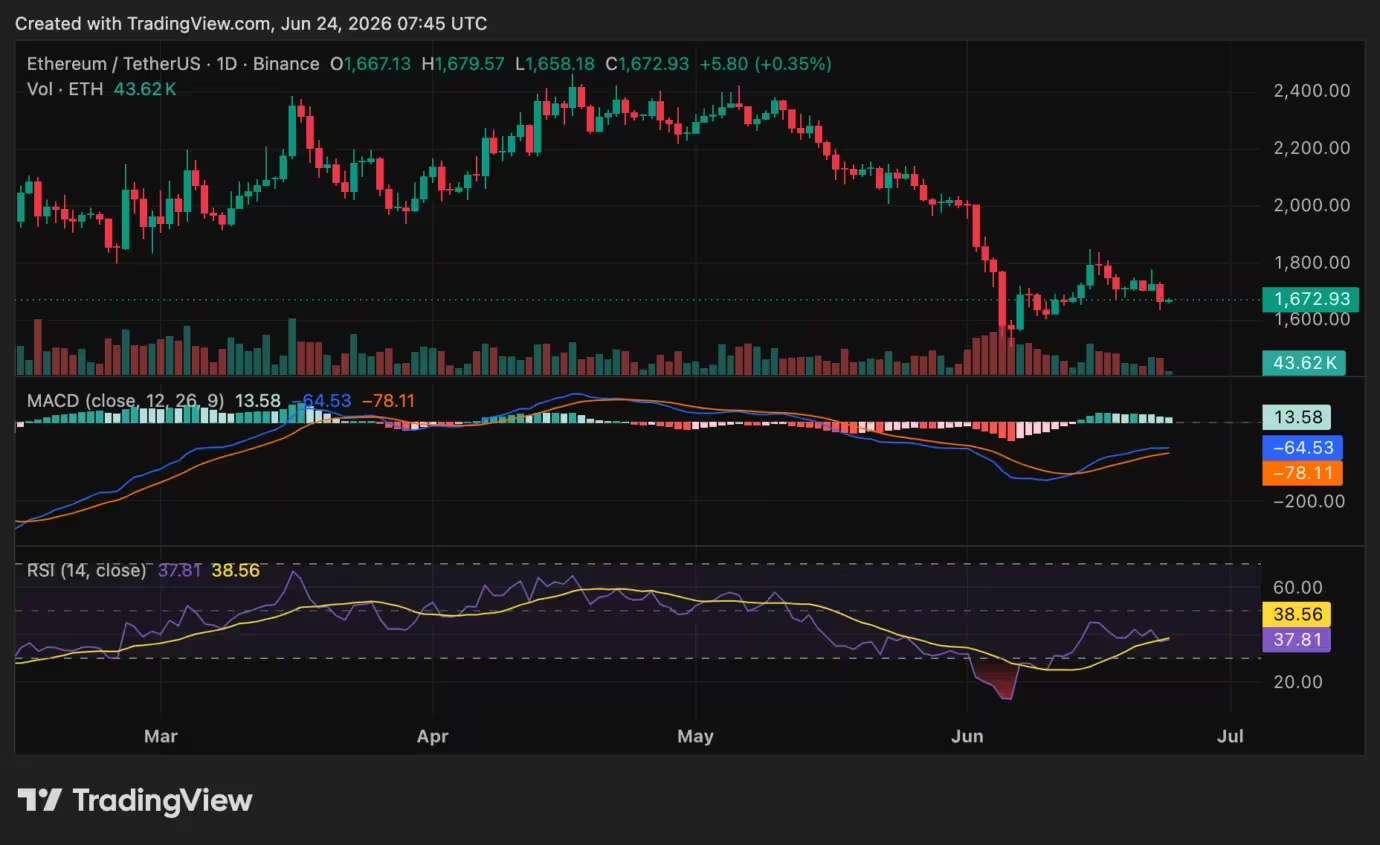
Ethereum (ETH) price chart
Chart patterns traders are watching
Several analysts flagged bearish structures that would reinforce downside risk if confirmed. One analyst pointed to a potential head-and-shoulders formation with a decisive neckline — a clean break below that neckline would validate a reversal scenario. Others emphasize that a higher low above recent support is needed to set up another credible breakout attempt toward $2,500-plus in a more extended bullish scenario.
Spot ETF outflows and institutional demand
Spot Ethereum ETFs recorded net outflows of $82.351 million in the most recent session, marking the fourth straight day of withdrawals according to SoSoValue. Those outflows continue to create headwinds for ETH, as institutional demand via ETFs has been a significant source of buying pressure since their launch.
When institutional flows turn negative, price often loses a layer of support. Traders have noted the combination of ETF outflows and weakening momentum as a key reason why ETH has struggled to sustain gains above short-term resistance.
Derivatives and exchange-level signals
Open interest and exchange reserves point to diminished speculative appetite. Ethereum futures open interest on Binance fell to approximately $4.16 billion — the lowest level in more than three months — suggesting traders are closing positions or reducing leverage after recent volatility. Lower open interest reduces the probability of large, forceful liquidations but also reflects weaker speculative demand for ETH.

Binance’s Ethereum reserves
CryptoQuant data also showed Binance’s ETH reserves climbed to 3.86 million ETH on June 23, the highest since May 12. That represented an increase of roughly 230,000 ETH (about 6.3%) from June 9. At the same time, Bitcoin reserves on Binance dropped by roughly 9,200 BTC during early June, and stablecoin balances shifted: USDT reserves rose to about $39.7 billion while USDC balances fell to around $5.7 billion.
Higher exchange ETH balances can suggest more supply available to the market, which may increase selling pressure if depositors intend to liquidate. The rise in USDT dominance — trading near 8.75%, close to the 9% level last seen during the FTX collapse in November 2022 — is another metric traders monitor for signs of market risk aversion.

Ethereum futures open interest on Binance
What the derivatives picture implies
Lower open interest and rising exchange balances typically point to a more cautious market: fewer leveraged bets, reduced directional conviction, and a higher likelihood of sideways or downward moves until buying returns. For ETH to reassert a bullish case, open interest and institutional flows will likely need to stabilize or pick up alongside technical breakouts above $1,750 and then $1,800.
Macro and geopolitical backdrop
The wider macro environment added another layer of uncertainty. Geopolitical commentary and developments — including political debate in the U.S. linked to Iran policy — have the potential to shift investor risk sentiment. Risk-off moves tend to reduce appetite for volatile assets like crypto, driving flows back into perceived safe havens.
When geopolitical headlines intensify, traders often reduce exposure and de-risk portfolios. That behavior can amplify selling in already fragile markets such as Ethereum when institutional and retail participants pull back simultaneously.
Analyst views and trade scenarios
Prominent on-chain and technical traders have laid out clear scenarios. One popular view: bulls need to defend a higher low near the $1,700–$1,750 zone and then push above $1,800 to regain credible upside momentum. Without that, analysts expect deeper retests, with $1,580 cited as a near-term target and further support levels in the range of $1,505 to $1,385 if selling pressure persists.
Other market commentators argue that if ETH reclaims $1,750 and then clears $1,800, renewed momentum could propel the market back into the prior trading range and open the path toward $2,500-plus over time — provided institutional flows and derivatives activity return.
"Bulls would need to attempt to put in a higher low around this region and break it on the next attempt," one trader said, underscoring the importance of immediate support zones.
Practical watchlist for traders
- Immediate resistance: $1,750, then $1,800. A daily close above these levels with rising volume and improving RSI would be a constructive sign for bulls. - Near-term support: $1,580 is the next key target if price breaks down further, followed by deeper support toward $1,505 and $1,385 in more stressed scenarios. - On-chain/exchange signals: watch Binance ETH reserves and futures open interest for shifts in supply/demand dynamics. - Macro risk: monitor headline risk tied to geopolitical developments and broad risk sentiment, which can trigger rapid flow changes.
Conclusion: stabilization, not yet a reversal
Ethereum’s price action around $1,670 reflects a market that is stabilizing but not convincingly reversing. ETF outflows, rising exchange reserves, and lower futures open interest all point to subdued institutional demand and reduced risk appetite. Technical indicators show some short-term bullish cues, but key momentum metrics remain below neutral levels.
For traders and investors, the immediate path higher requires ETH to defend short-term support and reclaim $1,750 before attempting to challenge $1,800. Until institutional flows and derivatives activity improve, expect price action to remain range-bound with downside risk if key support breaks. Close monitoring of ETF flows, exchange balances, open interest, RSI, and MACD will be critical to identifying the next sustainable trend in Ethereum and broader crypto markets.
"Ethereum is now trading below the 200-hour SMA," said crypto analyst Ali Martinez. “As long as this level remains lost, I believe $1,580 remains the next key target.”
BATMAN also flagged a possible head-and-shoulders setup forming on ETH. The pattern includes a left shoulder, head and right shoulder, with the neckline acting as the key level. A clean break below that neckline would confirm the reversal setup.
For now, Ethereum needs to reclaim $1,750 and then break $1,800 before the market can make a stronger bullish case.
Source: crypto

Comments
coinpilot
wow didnt expect spot ETF outflows for 4 days straight. bulls gotta defend 1750, otherwise 1580 is real. messy rn
atomwave
Is this even true? ETF outflows + rising exchange ETH makes me uneasy. Price below 200h SMA, so where's the bid? feels fragile, imo

Leave a Comment