
5 Minutes
Bitcoin Approaches 2026 Lows as Traders Eye Liquidity
Bitcoin (BTC) is drifting back toward its yearly low around $59,000 after a stalled recovery left bulls unable to reclaim key resistance. Traders are increasingly focused on a concentrated liquidity pocket below $59,000 that could catalyze a short-term sell-off. At the same time, on-chain and exchange flow data suggest selling pressure is easing, which may limit the severity of any downside move.
Technical Setup: Resistance, Channels, and Key Levels
BTC failed to close the gap inside the daily fair-value range between roughly $67,500 and $70,500, allowing sellers to retake control near the 50-day and 100-day exponential moving averages. That rejection pushed price below an ascending channel and confirmed a bearish break of structure on the four-hour chart. The market now trades beneath the channel range with internal liquidity and short-term support near $60,700, and the yearly low at $59,000 acting as the primary defense for bulls.

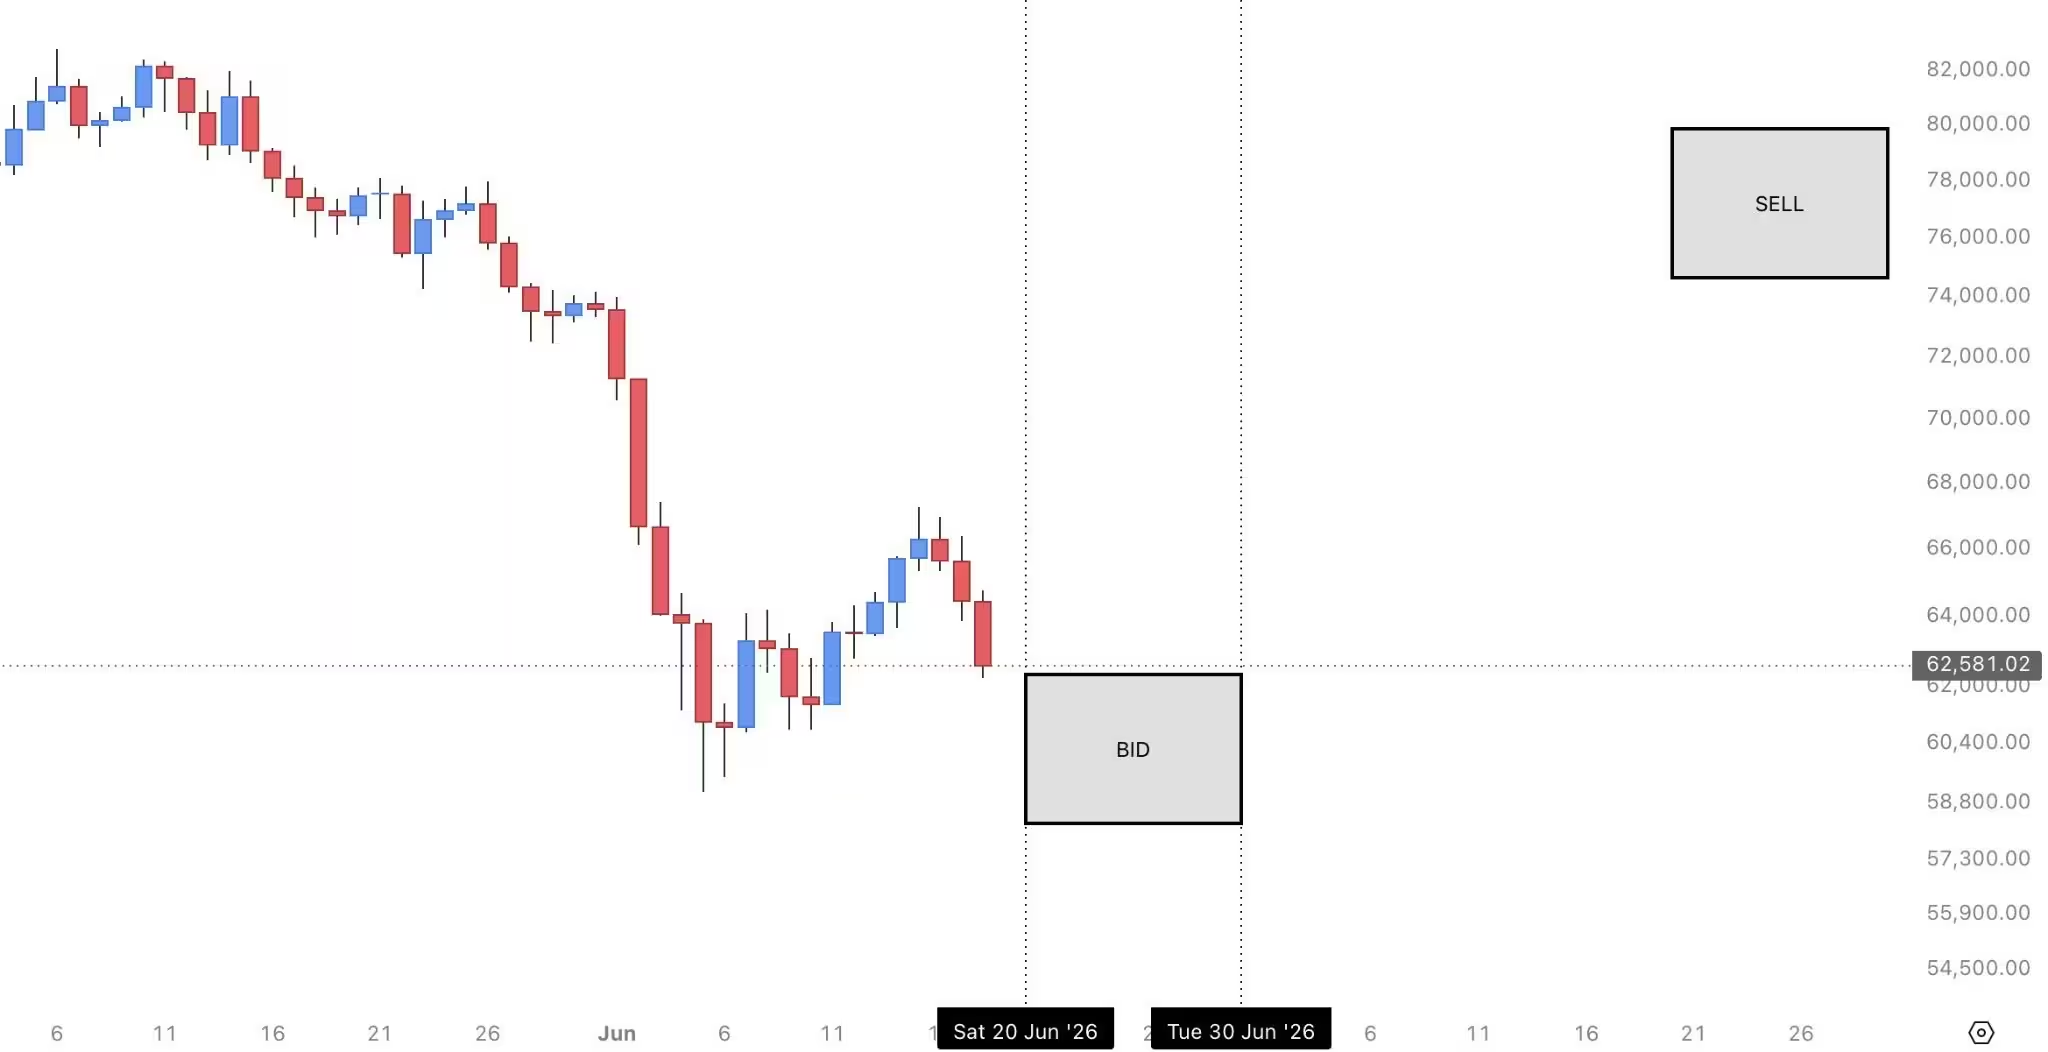
BTC/USD, four-hour chart.
Why $59,000 Matters: Liquidity and Liquidations
Liquidation-level data paints $59,000 as a high-risk zone. Roughly $4 billion in cumulative leveraged long positions are concentrated around this level. If price slips into that pocket, forced selling could trigger a liquidity sweep, removing late long positions and creating a sharp, short-lived downside move. The next large cluster of liquidity sits near $68,000, where over $4.75 billion in cumulative positions are located, making that zone a likely magnet during any rebound.
Momentum Signals and Possible Relief Bounce
Momentum indicators are also flirting with extremes. The relative strength index (RSI) is near oversold territory and would likely fall below 30 if BTC revisits its yearly low. Historically, such readings can precede sharp relief rallies after liquidation events, as capitulation flushes supply and allows strong hands to re-enter at discounted prices.
Trader Views: Front-running Liquidity and Staying Cautious
Market participants are divided on how the sweep might play out. Some traders, recalling market behavior in late 2025 when BTC front-ran a liquidity zone above $140,000, argue that Bitcoin could front-run the pool below $60,000 rather than fully sweeping all stops. Others caution against excessive bearishness in the short term, observing technical hints that a bottoming process could form toward the end of June.
BTC/USD, one-day chart analysis by LP.
Exchange Flows: Mid-Size Inflows Fall, Reducing Immediate Sell Pressure
On-chain flow metrics add nuance to the technical picture. CryptoQuant data shows inflows from mid-size investors to major exchanges fell to their lowest levels since early April. On June 19, Binance saw roughly 3,500 BTC in inflows, Coinbase nearly 3,000 BTC, and Coinbase Prime about 1,700 BTC. Since exchange deposits are a common proxy for selling intent, this decline suggests one important source of near-term sell pressure has eased.

BTC exchange inflow structure by mid-size investors.
What Lower Exchange Inflows Mean
Reduced deposits do not equate to renewed demand, but they do indicate that fewer coins are being primed for immediate sale. For traders and institutional allocators, lighter exchange-side pressure can make downside moves shallower and recovery rallies more sustainable. In the current context, lower inflows reinforce the idea that any $59,000 liquidity sweep may be temporary and followed by absorption from longer-term holders.
Outlook: Prepare for a Short-Term Sweep, Watch On-Chain Signals
Traders should prepare for a potential short-term sweep into the concentrated liquidity pool below $59,000, driven by leveraged long liquidations. However, exchange inflow metrics and classic momentum oversold readings suggest that bulls could absorb the dip and position for a rebound toward the mid-to-high $60,000 range. Risk-aware traders will monitor liquidation clusters, exchange flow, and RSI for signs that a capitulation low has been reached before committing to larger long exposures.
Key crypto indicators to watch: liquidation heatmaps, exchange inflows (Binance and Coinbase), RSI, EMA trends, and clustered liquidity near $59,000 and $68,000. Together, these metrics will help define whether the next move is a quick liquidity hunt or the start of a deeper downtrend.
Source: cointelegraph


Leave a Comment