
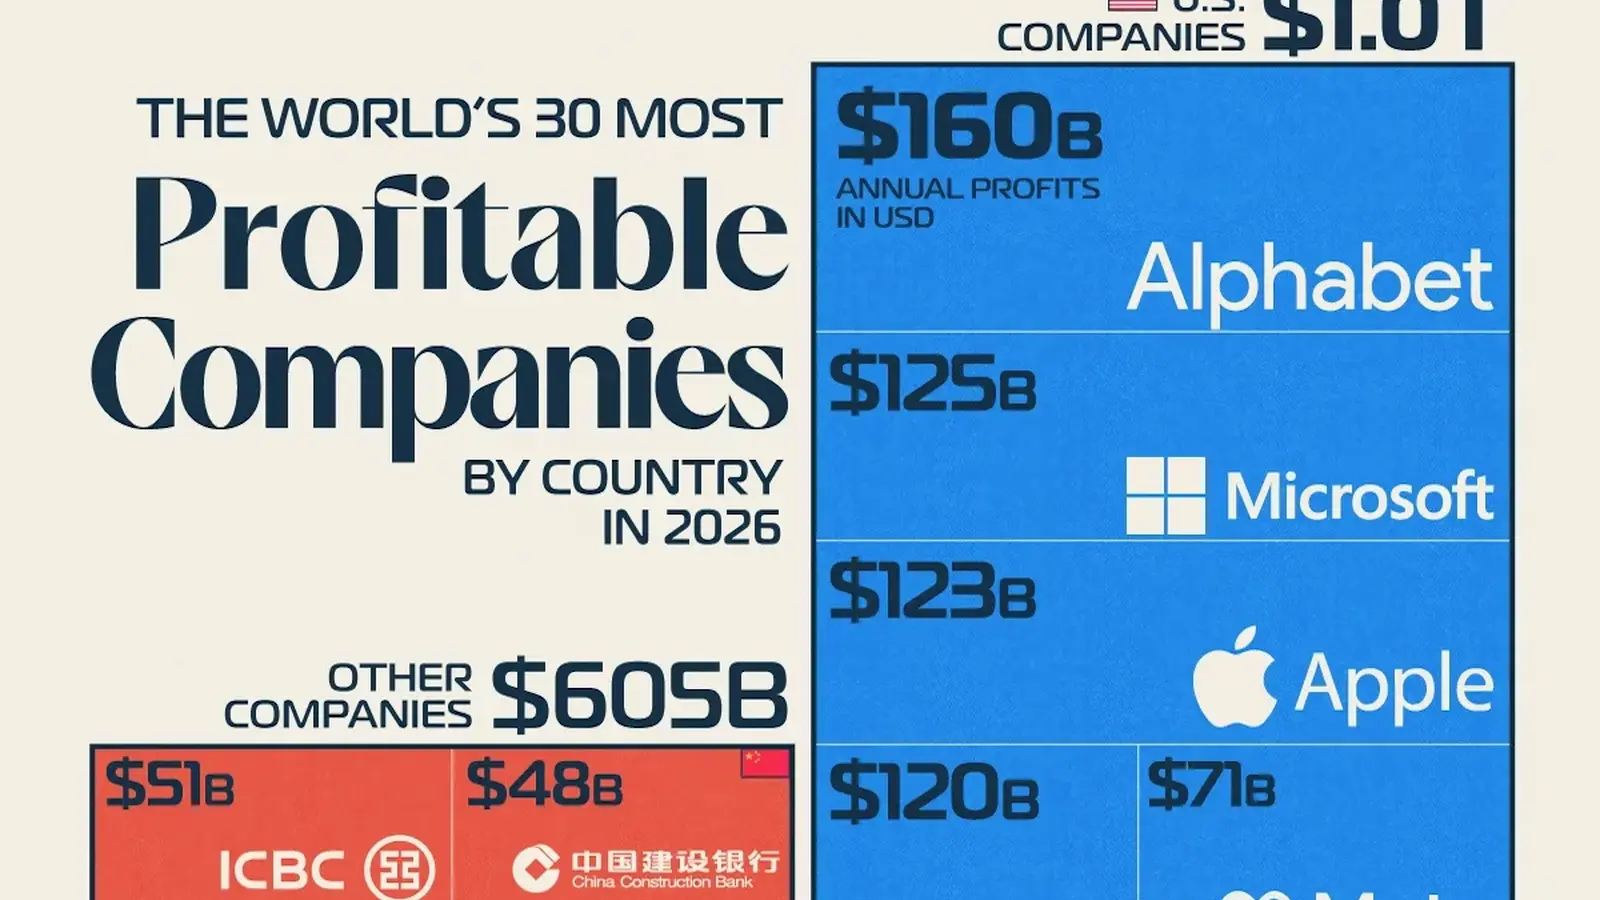
Skyscrapers of profit, and most of them shine from the US West Coast. More than half of the world’s 30 most profitable companies in 2026 are American, and together they posted roughly €930 billion in annual net income over the past 12 months.
At the summit sits Alphabet, reporting about €149.0 billion. Hot on its heels are Microsoft (€116.4 billion), Apple (€114.0 billion) and Nvidia (€111.7 billion). These four alone sketch the outline of how software, cloud services and semiconductors still drive modern corporate returns.
Top earners: where profit clusters
- Alphabet (Technology) — €149.0 billion
- Microsoft (Technology) — €116.4 billion
- Apple (Technology) — €114.0 billion
- Nvidia (Technology) — €111.7 billion
- Saudi Aramco (Energy) — €92.3 billion
- Amazon (Retail) — €84.4 billion
- Berkshire Hathaway (Financials) — €67.4 billion
- Meta (Technology) — €65.7 billion
- TSMC (Technology) — €58.1 billion
- JPMorgan Chase (Financials) — €54.5 billion
Beyond the top ten, familiar names from Asia and finance round out the list: Samsung (€54.4 billion), SK Hynix (€49.0 billion), the Industrial and Commercial Bank of China (€47.7 billion) and China Construction Bank (€44.8 billion) among them. The full roster reads like a map of global economic power: US tech and finance, East Asian chipmakers and state-backed Chinese banks.

Why does the US dominate? Consider profit gravity: decades of skilled immigration, generous technology parks, top-tier universities and a venture capital ecosystem that funnels capital at scale into startups and scale-ups. The result is concentration — a handful of platforms capture enormous margins and then compound them through software licensing, cloud infrastructure and proprietary chips.
Asia’s corporate giants are no afterthought. Taiwan’s TSMC remains the world’s leading contract chipmaker, capturing €58.1 billion in net income as demand for advanced semiconductors stays high. South Korea’s Samsung and SK Hynix together contributed roughly €103.4 billion to the global profit pool. In China, big state-linked banks and tech conglomerates still show formidable returns: Tencent and PetroChina appear among the most profitable non-US firms, each with tens of billions in annual net income.
Then there is Saudi Aramco — the lone non-American in the top five. With roughly €92.3 billion in profit and production near 13 million barrels per day, it remains a force in energy markets even as its earnings ebb and flow with crude prices and regional volatility. Aramco’s profit fell from earlier peaks after the oil price slump in 2025, and geopolitical instability has continued to shape its outlook into 2026.
It’s not just about sectoral dominance. Retail giants such as Amazon (€84.4 billion) and Walmart (€20.4 billion) and financial behemoths like Berkshire Hathaway (€67.4 billion) and JPMorgan (€54.5 billion) show how scale and distribution economics matter across industries. And small margins multiplied by vast scale can produce startling bottom-line results.
For investors and policymakers, the headline is clear: intellectual property, capital concentration and access to deep talent pools remain the biggest drivers of corporate profitability in 2026.
Expect the map to keep shifting. New chip nodes, AI adoption cycles and energy-market turbulence will redraw winners and losers. But for now, the profit leaderboard tells a simple story: where innovation, scale and capital intersect, extraordinary returns follow.


“I love exploring gadgets, apps, and trends that redefine how we connect, work, and play in a digital world.”

Discussion
Leave a Comment
Comments (2)
Worked with chip fabs, TSMC margins are nuts. Not surprised Nvidia leads tho, but Aramco still a wildcard. Seen supply shocks firsthand, markets'll shift.
Is this even true? US tech dominance looks real but the numbers feel skewed, tax tricks, buybacks, offshore profits... Anyone got good sources?