
Thousands of tiny tremors. Noise to the untrained eye. A whisper of a fault about to wake. That is where the signal hides.
When small quakes stop being random
Seismologists have long faced a blunt problem: the data are abundant but the meaning is fuzzy. Catalogs swell with small earthquakes, swarms, and aftershocks. Most of them are routine. Occasionally, an apparently ordinary cluster turns out to be the preface to a much larger rupture. Distinguishing the noise from a genuine preparatory signal is the challenge that a team at GFZ Helmholtz Center for Geosciences has taken up with a data-first approach.
Rather than instructing a computer to look for a preconceived pattern, the researchers let the data dictate the pattern. This is unsupervised machine learning: algorithms that find structure inside raw information without human labels or a checklist of what to expect. It is an approach already proving useful in other geohazards, such as landslides and volcanic unrest.
Working with scientists including Dr. Sadegh Karimpouli and Prof. Patricia Martínez-Garzón, the GFZ team built a pipeline that groups earthquakes into related clusters or "families" and then describes those families with physical and statistical fingerprints. The algorithm organizes families into categories that correspond to different modes of seismic behavior. When a region shifts from its usual background categories into a critical category, that change may signal the system is edging closer to failure.
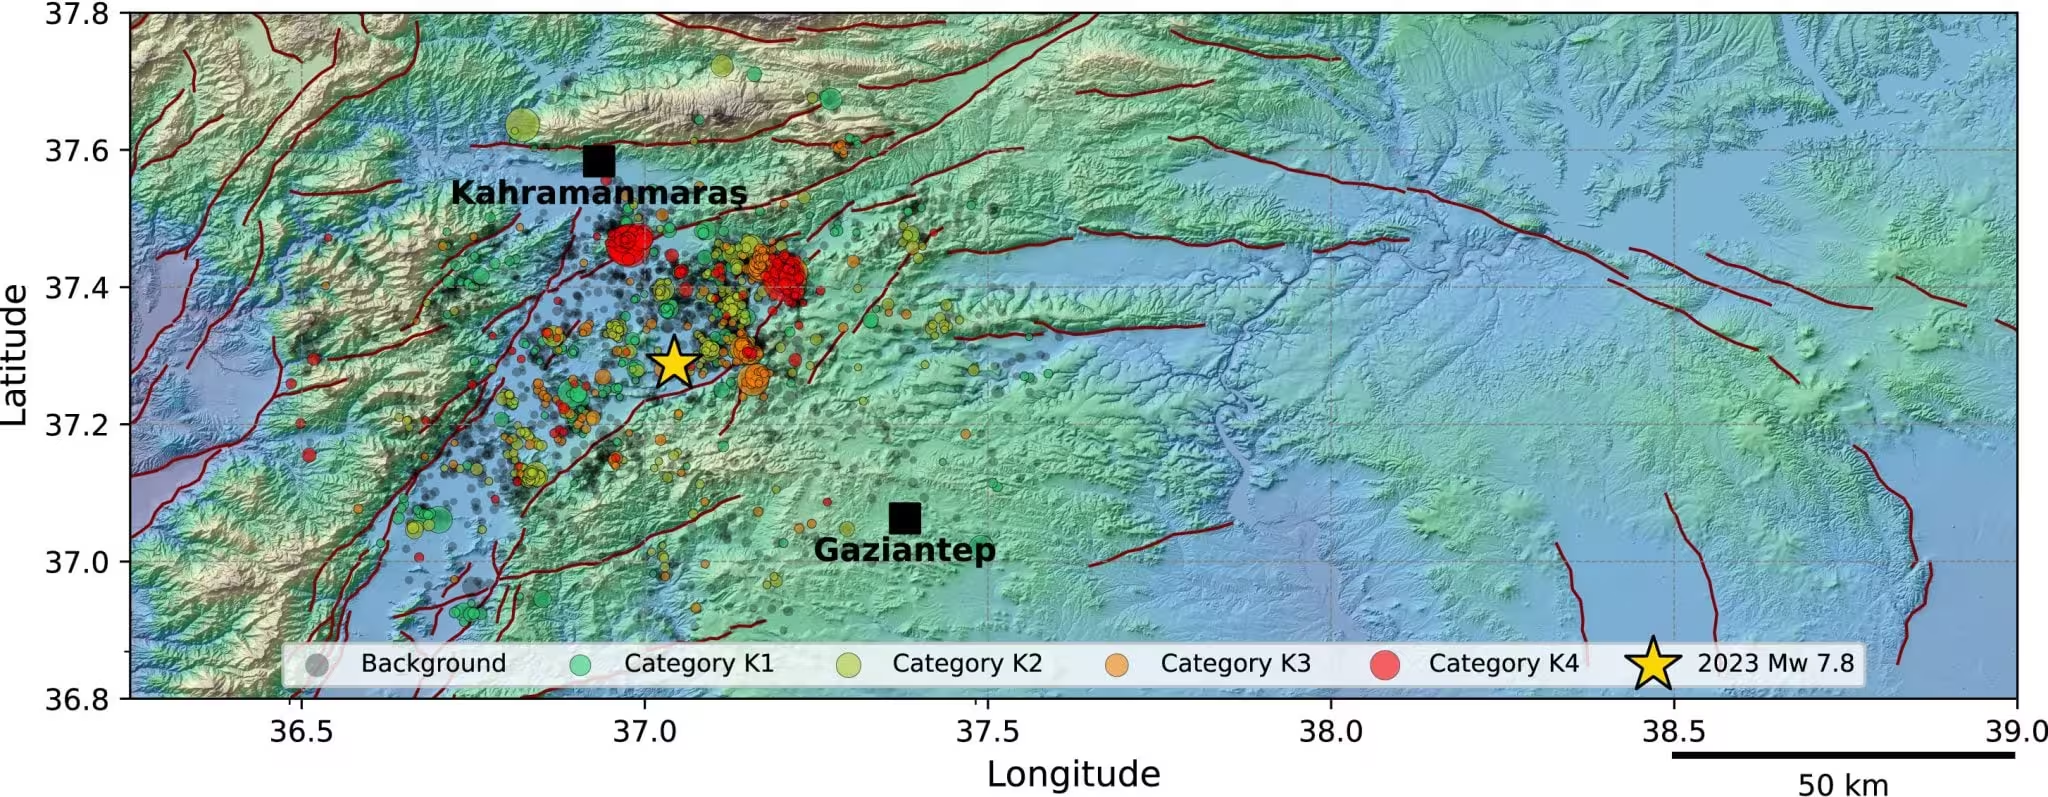
Categorization of seismicity families prior to the 2023 MW 7.8 Kahramanmaraş (yellow star) earthquake. Map view showing the spatial distribution of event family members color-coded with their corresponding category. Background events are shown in grey.
Turning catalogs into interacting families
Traditional earthquake catalogs treat each event as a separate point in space and time. That is useful, but incomplete. In nature, earthquakes talk to each other. A small rupture alters local stress, nudging other patches of the crust toward or away from failure. To capture those interactions, the GFZ team groups events by proximity in space, time, and magnitude. The result is a set of families: coherent groups of events that reflect an interacting patchwork of stress and slip.
Each family is then characterized through multiple metrics. How tightly are events clustered? Do they concentrate into a narrow zone or spread over a broad area? Is the release of seismic strain accelerating or stalling? What is the temporal ordering of magnitudes? These descriptors feed the unsupervised model, which arranges families into recurring categories that appear to map onto stages of stress evolution.

.avif)
Categorization of seismicity families prior to the 2023 MW 7.8 Kahramanmaraş (Türkiye) earthquake at a major strike-slip plate boundary. Left: Colors represent chronological order. Right: Colors represent the new categories of event families.
The shift to family-based analysis matters because it recasts the question. Instead of searching for a single foreshock signature, scientists ask whether the collective behavior of interacting events changes in a direction consistent with increasing instability. The method was calibrated in laboratory stick-slip experiments first, where fault physics can be observed under controlled conditions. The big test remained: would the approach work on messy, real-world seismicity where instruments are imperfect and faults are far more complex?

Categorization of seismicity families prior to the 2014 MW 8,1 Iquique (Chile) earthquake in a subduction zone. Left: Colors represent chronological order. Right: Colors represent the new categories of event families.
Patterns that appeared before several major quakes
To answer that question, the team applied the method retrospectively to several well-documented sequences across different tectonic settings. The list includes the 2023 Mw 7.8 Kahramanmaraş earthquake in Türkiye, the 2014 Mw 8.1 Iquique event in Chile, and the 2009 Mw 6.1 L’Aquila earthquake in Italy. In each case the algorithm detected a distinct transition in seismic behavior weeks to months before the mainshock.
That preparatory signature was not a single telltale. Instead, it combined three tendencies: increasing clustering and interaction among events, stronger localization in space and time, and a rise in released seismic strain. In other words, seismicity organized itself. Background tremors that had once been scattered and episodic began to coalesce into a more predictable, concentrated pattern. The researchers interpret this as a fault system evolving toward a critical state.
"We observed a move from relatively diffuse, background activity to a more structured, critical mode prior to rupture," says Dr. Karimpouli. "In the sequences we analyzed, this reorganization emerged weeks to months before the large event."


Categorization of seismicity families prior to the 2009 Mw 6.1 L’Aquila (Italy) event on a set of fragmented normal faults. Left: Colors represent chronological order. Right: Colors represent the new categories of event families.
Not every earthquake prepares visibly
One of the most important outcomes of the study is negative evidence. The method did not find a preparatory category for every large earthquake. For the 2016 Amatrice quake in Italy and the 2024 Noto earthquake in Japan the analysis failed to identify a clear shift relative to the preceding activity. Those events appear to have occurred without the distinct seismic reorganization seen in other sequences.
That variability highlights two realities. First, not all faults announce their failure in the same way. Fault geometry, ambient stress, the rate of tectonic loading, and local rheology all influence whether and how seismic preparation appears. Second, monitoring capability matters. A subtle preparatory signal cannot be detected if instruments are sparse or if catalog completeness is low at the relevant magnitude range.
"Some faults may fail without obvious seismic warning signs, which makes forecasting difficult," notes Prof. Patricia Martínez-Garzón. "Understanding which tectonic settings and monitoring configurations are most likely to reveal preparatory behavior is a priority for the field."
Practical forecasting and prospective tests
Retrospective detection is one thing. Operational forecasting is another. To probe real-world utility, the researchers ran the approach prospectively inside historical sequences. They used earlier activity to define the typical categories for a region, then updated the classification as new events arrived. When a new category appeared that deviated from the established background, it served as a flag that the system was entering a different state.
This real-time framing does not amount to deterministic prediction. The authors are explicit about that. Instead, the method provides a diagnostic: a way to recognize when a fault system is behaving unusually. That information could feed into operational earthquake forecasting frameworks where probabilistic guidance is already the norm.
Integrating such tools into monitoring centers would require robust thresholds, careful false alarm analysis, and an understanding of which signal types are actionable. But the study demonstrates a scalable pathway. Machine learning can be used not merely to hunt for single foreshocks, but to monitor evolving patterns of interaction across thousands of small events.
Expert Insight

Dr. Lena Ortiz, a fictional seismologist and operational risk advisor with two decades of experience running seismic networks, summarizes the potential and limits succinctly: "Algorithms that spotlight changes in event interaction give us a new lens on fault behavior. They do not make predictions in the old sense. Instead, they raise situational awareness. That can be invaluable for emergency managers if the signals are calibrated and communicated with uncertainty clearly stated."
Why this matters for earthquake science and society
The value of detecting preparatory phases is not only scientific. Early recognition that a system is moving into an unusual state could affect short-term preparedness, resource allocation, and public communication. Countries and regions with robust seismic monitoring and rapid data pipelines are better positioned to exploit such diagnostics. In places with sparse instrumentation, the same techniques may be blind.
From a scientific perspective, the study offers a way to test theories of earthquake nucleation and cascade. If certain categories consistently precede large ruptures, researchers can study the physical conditions that generate those categories. That feedback loop between data-driven pattern recognition and physical interpretation is key. Machine learning suggests patterns; physics explains them. Both are needed.
There are broader technological implications. The approach depends on high-quality, continuous seismic catalogs and fast computational workflows. Improvements in sensor networks, higher-resolution catalogs from dense arrays, and cloud-based analytics will make these methods more practical. Cross-disciplinary collaboration will be essential. Seismologists, data scientists, risk analysts, and emergency officials must work together to translate algorithmic flags into effective action.
Conclusion
The GFZ-led study demonstrates that unsupervised machine learning, when combined with a family-based view of seismicity, can reveal subtle preparatory behavior before some large earthquakes. The technique detects a characteristic reorganization: increased clustering, tighter localization, and greater seismic strain release. These features are not universal, but where they appear, they may mark a fault system moving toward instability.
Crucially, the method is a diagnostic, not a crystal ball. It expands the toolbox for operational forecasting by offering a way to monitor the evolving collective behavior of earthquakes. The next steps are clear: integrate these analyses into near-real-time monitoring, test them across more diverse tectonic settings, and build the operational frameworks needed to use such signals responsibly. If the field can do that, the whispers in catalogs might become useful alerts rather than background noise.
.avif)
Categorization of seismicity families prior to the 2023 MW 7.8 Kahramanmaraş (yellow star) earthquake. Left: Map view showing the spatial distribution of event family members color-coded with their corresponding category. Background events are shown in grey. Right: Magnitude-time distribution of event family members, with the cumulative number of all (background and clustered) events represented by solid lines.


“The cosmos has always fascinated me. I write about space missions, astronomy, and the technologies pushing humanity beyond Earth.”

Discussion
Leave a Comment
Comments (4)
feels a bit overhyped, lots of caveats. still, nice step toward usable diagnostics. thresholds and false alarms will make or break it
I ran microquake detection in a small network once, saw swarms that meant nothing, but this family view might've helped. curious to see real-time tests
Is this even true? Seems promising but how many false alarms would this trigger in practice, esp where sensors are sparse
wow this blew my mind, tiny quakes like whispers... if true, could change alerts. but can ML really cut through catalog noise??